2019 Admissions, part II - Falling yields
Falling yield and its network effects
In our continuing look at the just-released Department of Education statistics for 2019 admissions, we will next turn to declining yields and rising acceptances per student. 2019 data shows the previous decade’s trends extending, joining together to place increased pressure on colleges.
We had recalculated yield to exclude full-time entrants to open enrollment colleges, showing that yield had declined to below 25% for the first time in 2019.
The converse of this is that students are being accepted to more colleges than ever.
In 2009, students on average were admitted to fewer than 3 colleges in the cycle; that threshold has now exceeded 4.
Acceptances, Yield and Pricing - the Cycle
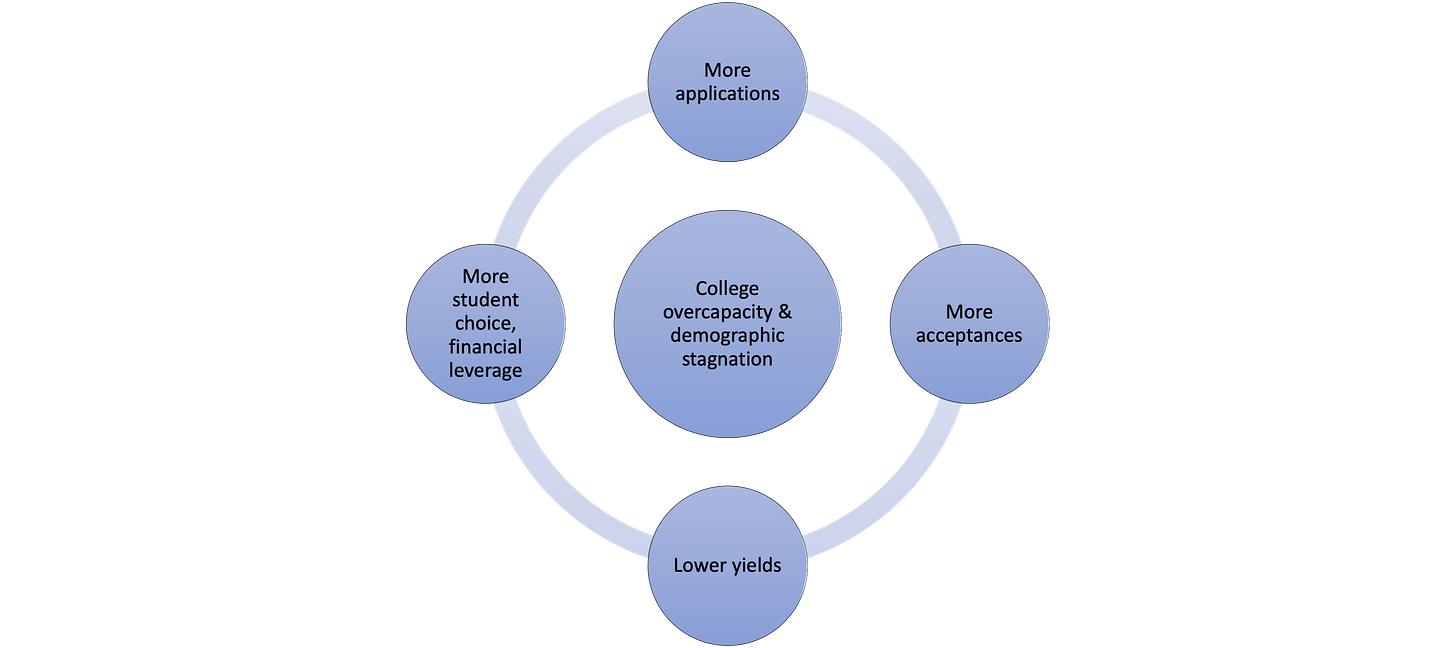
The cycle of more applications leading to more acceptances leading to lower yields leading to greater student choice and negotiating leverage all exists within an environment of static demographics and college overcapacity.
If high school classes were growing and the supply of student spots was limited, the dynamic would be weaker, helping colleges’ enrollment position. But future high school class sizes are likely to be stagnant and overcapacity looks to be permanent, especially with online education’s ability to scale up and educate additional students at little incremental cost. The current dynamic will consequently work in students’ favor for the foreseeable future, forcing most colleges to increase their flexibility and carefully control pricing.
Acceptances per student and network effects
Let’s step into abstraction for a minute to pull in a precept of Social network analysis, a field of research that studies the spread of information across a network. Enrollment is a complex multi-player process where the selling side (colleges) repeats the game each year and has access to better information. The buying side (students) plays the game once with inferior information, has more limited professional support and is atomized: information disseminates poorly across a high school graduating class and between class years.
Taking a theoretical extreme, if each high school grad were to apply to one college, they would be completely subject to that acceptance and would learn nothing at all about possible alternatives. This is where the number of acceptances per student kicks in. Multiple acceptances obviously benefit the student in question but they also spread information across the marketplace to the other colleges and students in the enrollment cycle, through financial aid appeals, through communication between students, parents and advisors about results, and through the media and professional relationships. Not every acceptance, rejection and financial aid offer leads to such communication but a fraction does, each one teaching participants more about this year’s market.
Seeing the chart above, you may be tempted to question whether an increase in acceptances from about 3 to about 4 is all that important. But information dissemination across a network does not increase linearly, it grows at a geometric pace as the number of connections between members of the network increases (this is the precept from Social network analysis). A geometric rate of increase makes the jump from 3 to 4 more significant than it looks at first.
All very abstract, but we want to underline how important that increase in acceptances per student is when looked at from the perspective of disclosing competitive information across the enrollment marketplace. It informs the selling side about competing colleges and the buying side about pricing, admissions and desirability. To us, it’s one of the most important fundamental metrics in the college marketplace and it’s moving in one direction. Hence, the Admissions Arms Race.
Lower yield’s indirect impacts
Yield declines also increase a college’s financial risk. As colleges admit more applicants to meet enrollment goals, the risk from missing their yield target rises - that is simple math. A 1% yield miss for 1000 admits has greater revenue consequences than for 500 admits. This logic adds to the incentives for struggling colleges to lower admissions standards and discount, which in turn places added pressure on stronger schools.
We don’t want to overburden this post with too much conceptual speculation, but will mention one other way lower yield benefits applicants. The fact that a single high school class theoretically plays the admissions game just once and doesn’t get the chance to apply what they learn to another round adds to students’ disadvantage in relation to colleges, which have long experience with the process. Expanding that single play into multiple application opportunities helps students learn and negotiate. One particularly important extra opportunity is the wait list and, of course, colleges expand wait lists to manage yield uncertainty.
So lower yields apply financial pressure on colleges and, through wait lists, work indirectly to advantage applicants by giving them more chances to manage their college enrollment. Notice how every single trend we examined here is evolving to increase students’ market power vis-a-vis higher ed. But that increased power does come at a cost. In our next installment, we will look at application fees and the financial costs to students of larger search lists.
You can also read this post and others at our CTAS website.


