

How much college costs, 2007-2018, Part II
How much college costs, 2007-2018, Part II
Price trends for undergraduate education - the history
In the previous post, we had presented Net Cost averages for all of US undergraduate schools along with the separate indices for 2- and 4-year programs. This post further separates average pricing between private and public schools, between schools of different sizes, and for highly selective schools.
Beginning with public and private classifications:
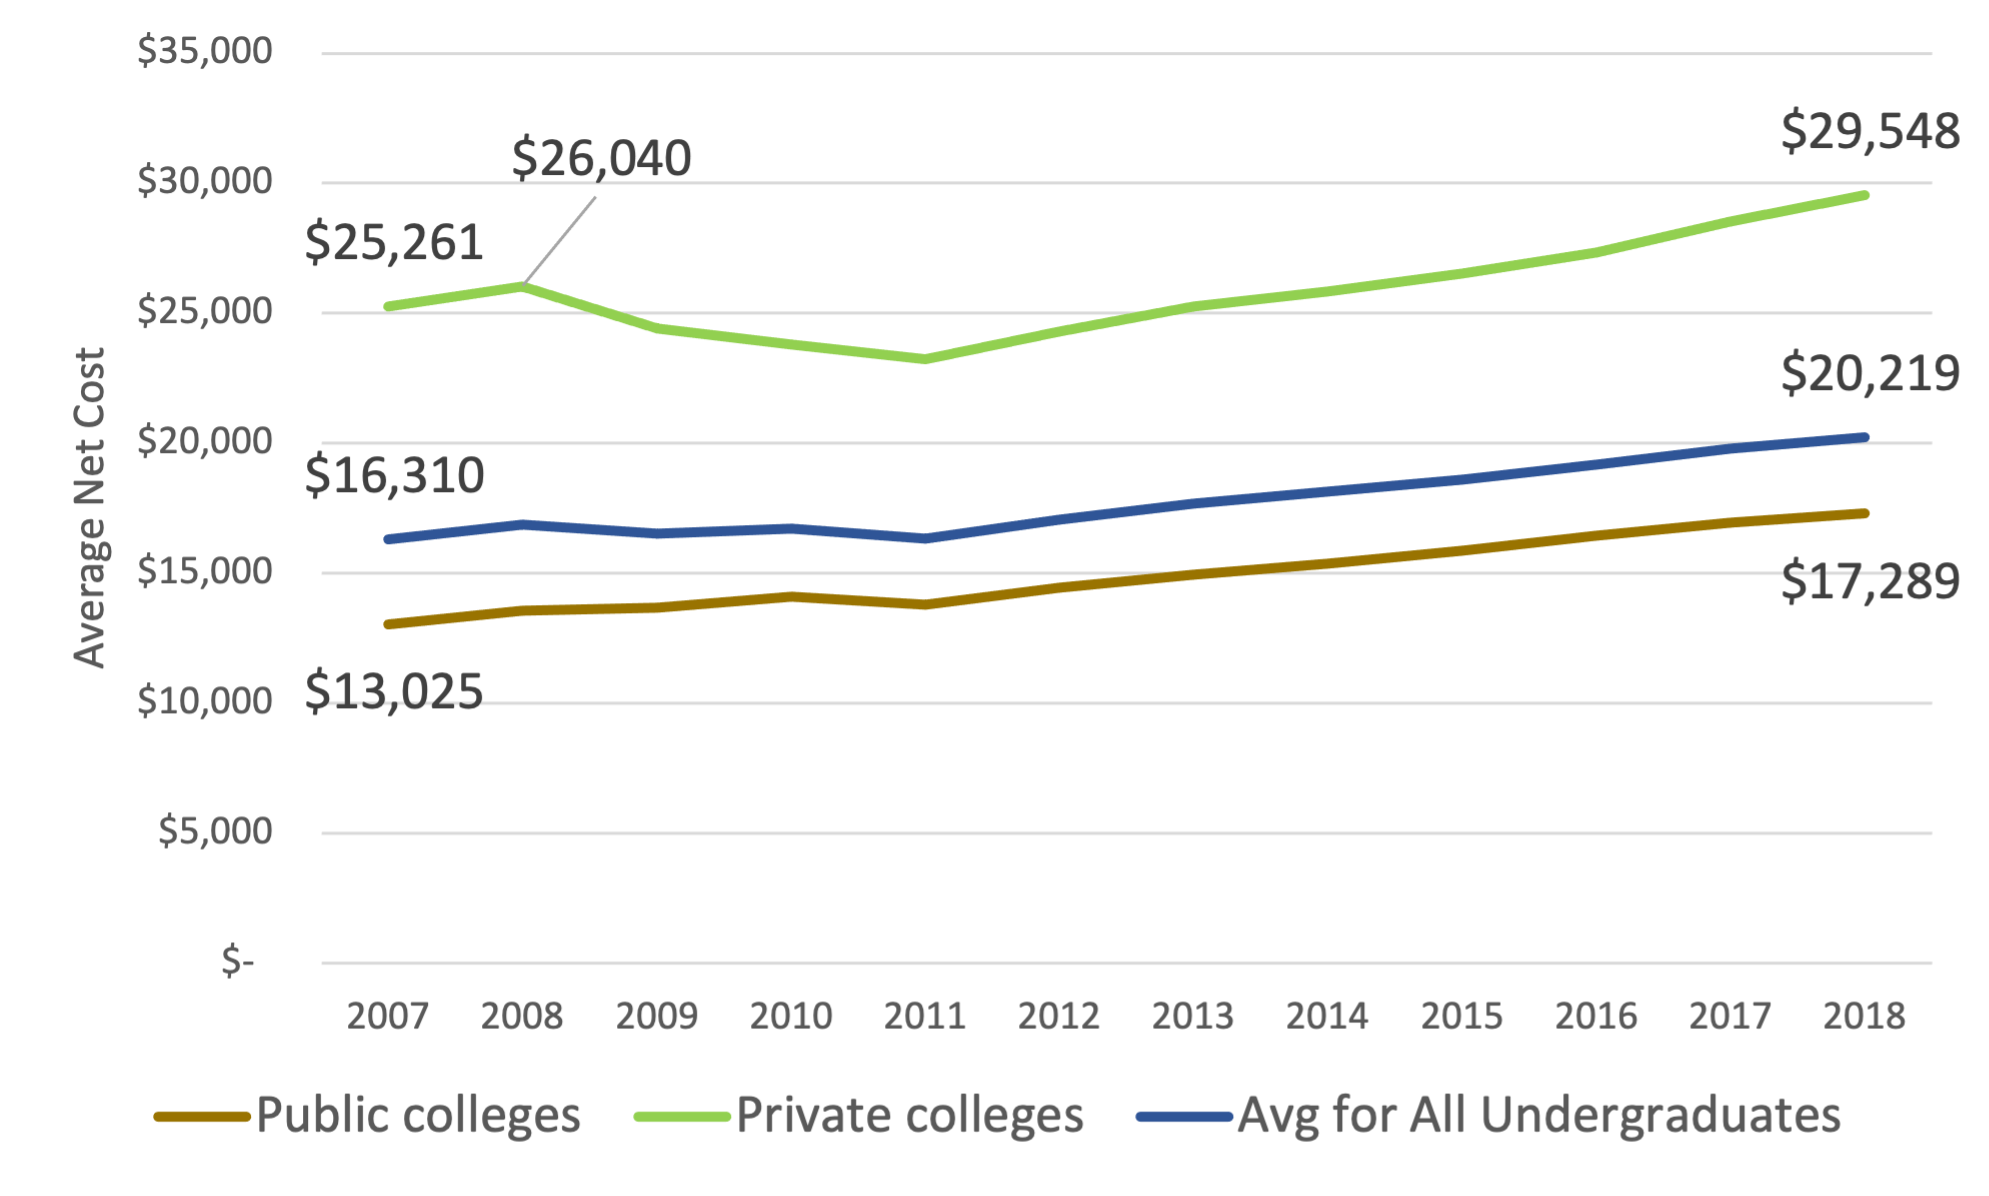
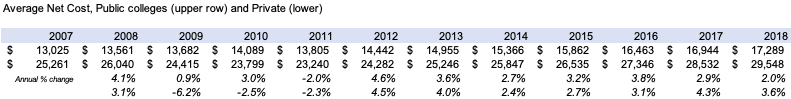
Public colleges saw annual Net Cost increases of 2.6% over this period, starting from a lower base than private schools, which averaged a lower 1.5%. (Net Cost is a measure of student spend so mix impacts affect these averages.) Private schools, who can be characterized as “swing” price setters, also exhibited more volatile pricing and discounted prices fairly aggressively during the Great Recession.
In terms of school size, bigger undergraduate programs have shown more market power in both pricing and in enrollment as is clear from this chart separating colleges into four categories: schools with >10,000 full-time undergrads, 5-10,000, 1-5,000 and <1,000 full time.
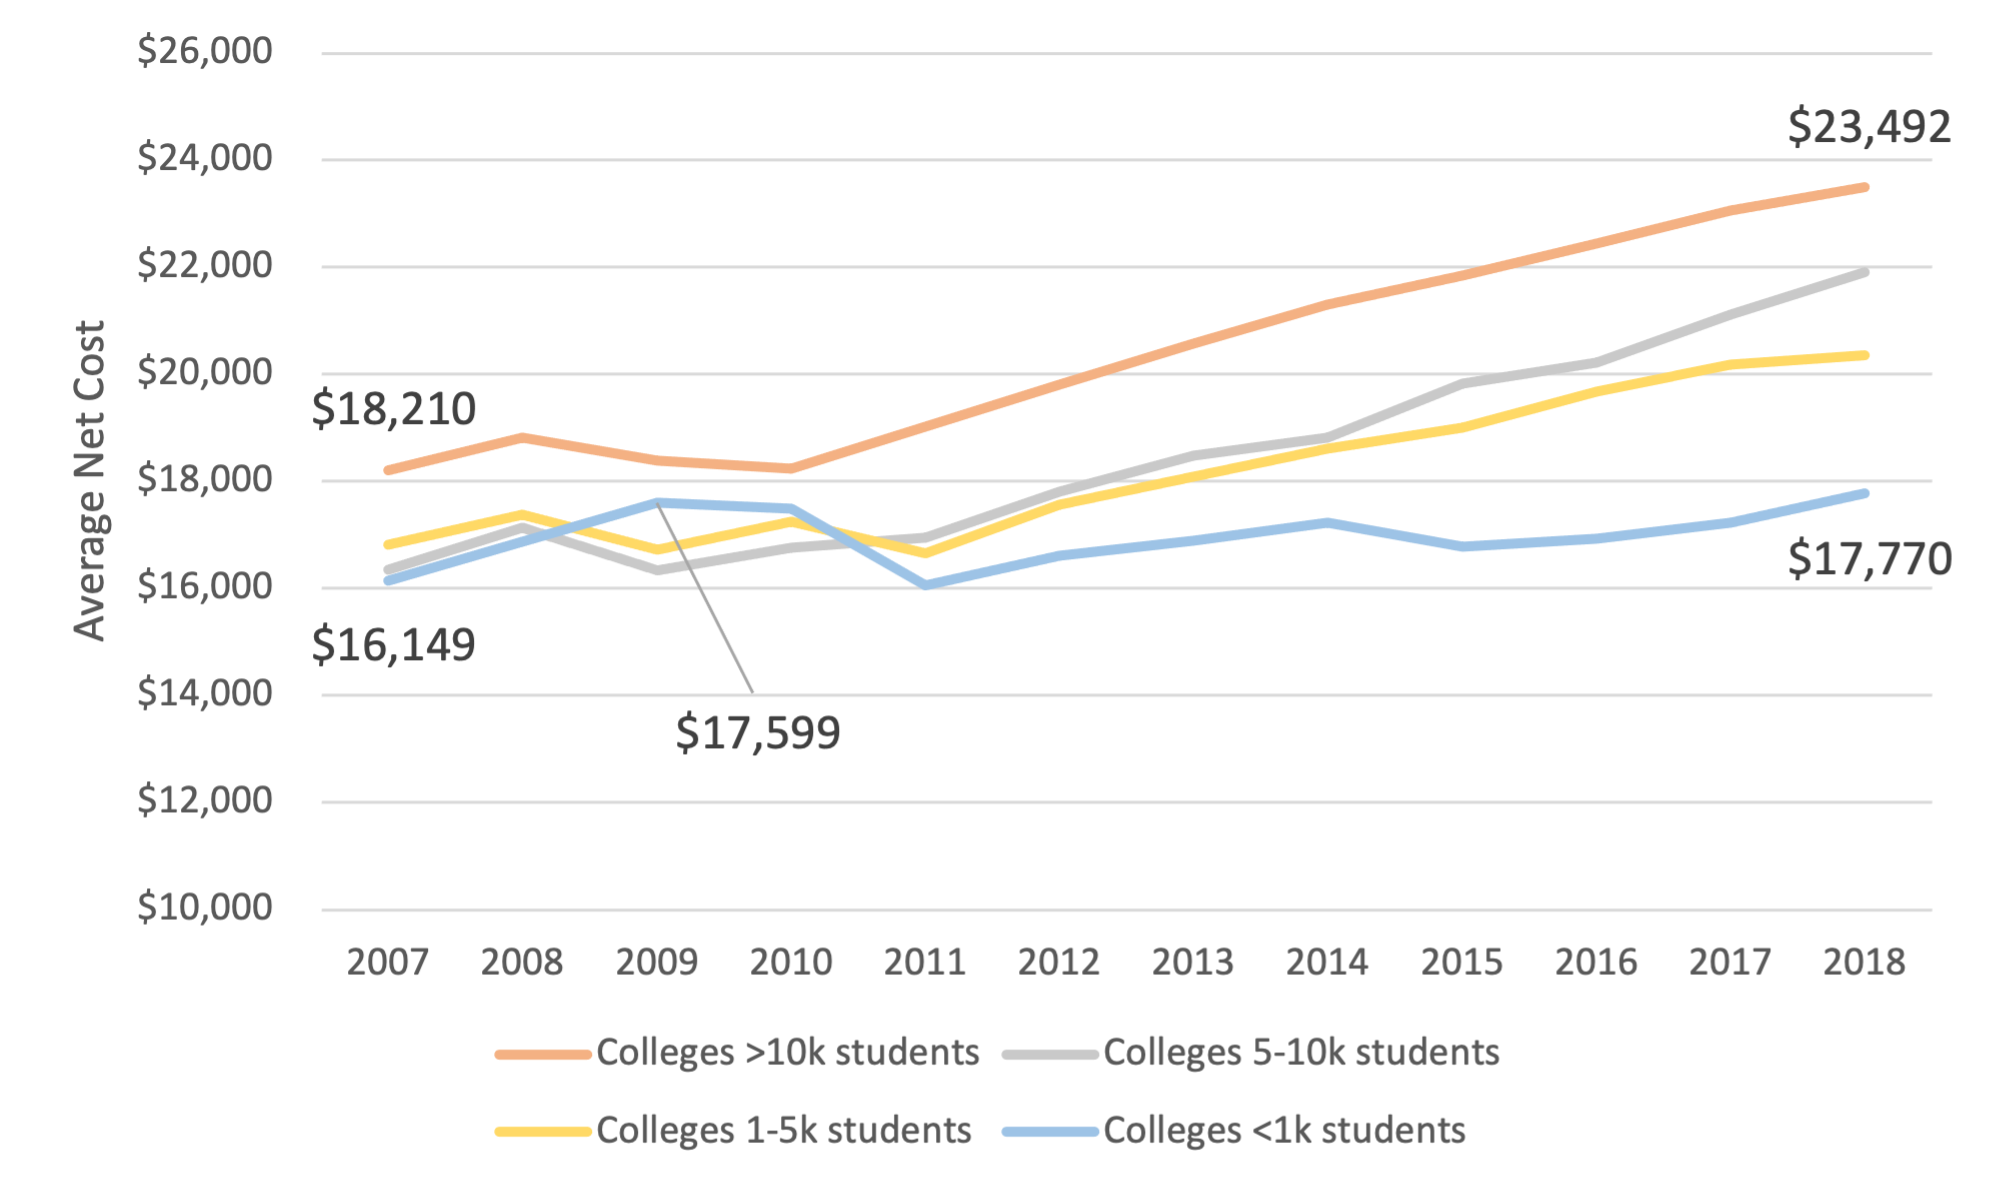
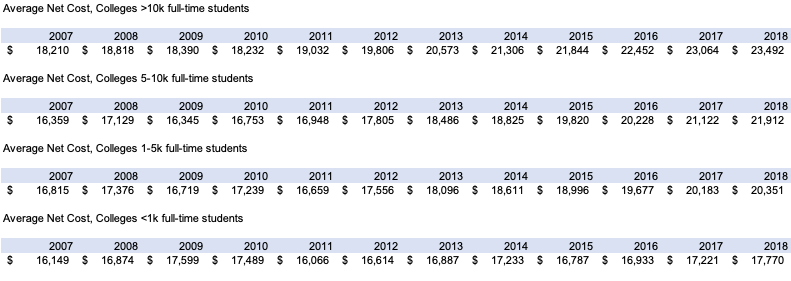
At the outset of the Great Recession, Net Costs for the smallest and largest categories were separated by about $2k; this disparity had surged to close to $6k by 2018. While the two larger segments above 5,000 full-time undergraduates showed growth rates of approximately 2.5%, the smallest schools with fewer than 1,000 full-time undergrads were able to raise prices only 0.7% annually. This performance by the small schools was only bit above the annual rate increases of 2-year programs, which was the weakest sector of any presented in this pair of overviews. (Again, mix affects these averages.) The enrollment and pricing weakness for small schools created a turbulent decade, with a large number of closings even before COVID, and putting in doubt the viability of the “micro” category. There is strong evidence that students clearly prefer large schools over a certain size threshold and that small schools have a dim future as a category.
Finally, selective colleges thrived, which will surprise no one. We divided this set of schools into those accepting less than 35% of applicants, those accepting less than 20% and the handful of Ivy League schools + Stanford + University of Chicago. (These sets of schools in these categories is not static, as the admissions arms race sharply increased the number of selective schools over the decade, a natural byproduct of applicants increasing the numbers of schools to which they apply.) As expected, the most selective schools had the most pricing power.

These selective schools were able to raise prices the most of all categories, with a 2.8% annual appreciation, slightly more than the big schools displayed in the previous category. The Ivy League+ group with their lavish endowments actually limited their increases to a 1.5% rate. But the message here is that even in the face of sharply increasing application volumes, these selective schools either showed restraint or were unable to hike prices even 3% - not a particularly high price inflation rate and below that shown in the period before the Great Recession.
The price decreases in this selective segment during the Great Recession are also notable and need future investigation. Why did their Net Costs drop at all, as their applicant bases were several times the size of their entering classes? Why was their price drop far larger than the decline in the average student’s family income? Median family income of households with one bachelor holder - the index we think is the best predictor of college pricing (very high correlation with acceptable statistical significance) - only fell in 2009 and generally was close to flat in the recession’s other years. Yet highly selective schools, despite their large applicant bases, nevertheless cut their Net Cost aggressively. Some of these schools have substantial endowments and financial resources so can do so relatively easily, but others do not. Likely reasons are an interplay of:
Non-financial academic & demographic objectives (enrolling a diverse set of the best students, maintaining stable acceptance rates);
Family income as a statistic does not fully reflect the economic trepidation of students and families during a recession, who economize on college spending out of fear;
Price competition with non-selective colleges struggling to hit their enrollment targets;
The ability to raise prices later for first-year students as they continued on in their college careers after their freshman year and their family finances recovered (need-based aid serving as a kind of income participation mechanism for the colleges).
All played some role, but their precise interaction needs to be elucidated with more analysis.
Stepping away from the minutiae, the big theme here is that higher ed has lost the ability to raise prices faster than inflation. Even colleges in high demand had to either restrain or cut their price levels during the Great Recession’s enrollment spike. Afterwards, as the economy recovered, undergrad program pricing strength got a bit better, but now faced headwinds from gradually declining enrollment numbers and excess capacity. It’s hard not to speculate about the cultural shifts behind this altered economic landscape, but we will restrain ourselves.
Find out more granular information on college pricing at the CTAS website.