The large diversity of offerings provided by US higher ed has led to a proliferation of metrics applying to cost, producing so many subtypes that it leaves even higher ed professionals confused (see here). This gap has harmed consumers – it is difficult for them to gauge prices. It has harmed institutions – undergraduate education is a highly price-sensitive purchase, making exact knowledge of where a college stands via-a-vis its competitors vital. And it has harmed higher education’s image – causing a prevalent view that college costs are rising out of control even after a decade of modest increases below the inflation rate.
To solve this, CTAS is introducing Net Cost. Net Cost is a consumer-centric metric which shows costs as they are presented in commercial transactions outside of higher education. It represents a full-time student’s cost of attending college including: tuition, room & board, fees and estimates of supplies, less institutional aid of all kinds (including need-based and merit), and less federal and state/local aid. Loans and other repayable amounts are excluded and do not reduce the cost. Room and board numbers for residential colleges come from their on-campus costs; for non-residential institutions, they come from college's own estimate of off-campus costs with certain adjustments. For total Average Net Cost covering all students enrolled at a college, in- and out-of-state costs are averaged in proportion to the student body’s residence status.
Net Cost applies to individual students and colleges but can also be homogenously applied across the industry to provide an average annual cost of US undergraduate programs. This industry Average Net Cost is weighted by Full-time Equivalent student across all degree-granting US colleges and includes all 2- and 4-year institutions in all 50 states and DC in a composite index.
Average Net Cost is:
Simple. It combines numbers into a single, simple figure. Higher ed price discussions seemingly always devolve into many subcategories, but this is not the purpose of an index. To take an example, the NASDAQ takes stock prices of companies in many industries, from semiconductors to food distribution, and distills it into one number. Individual stock prices and individual college costs are correlated; combining them into a single figure allows for easy comparison and understanding of trends.
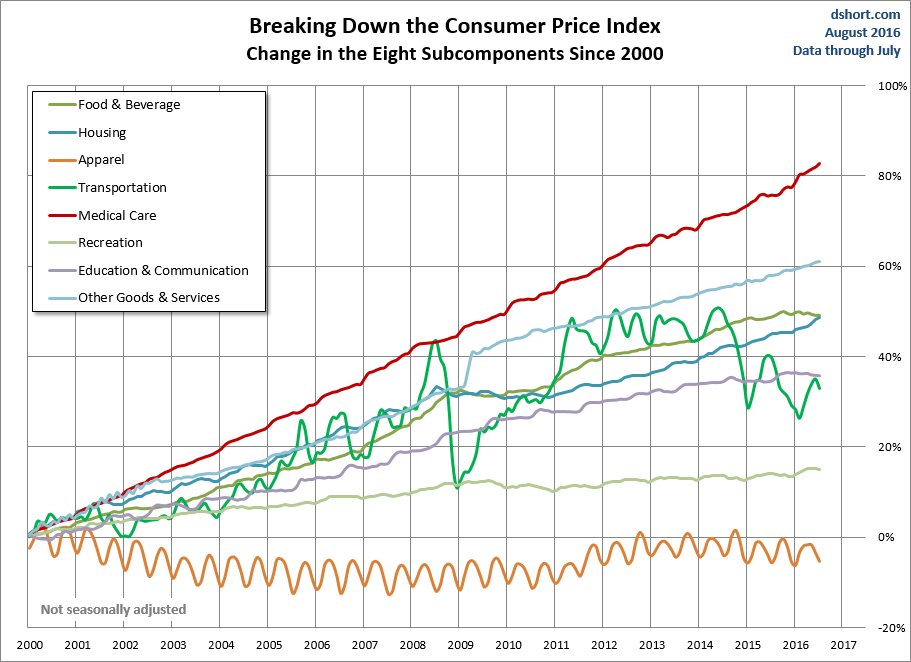
It uses Nominal dollars. Inflation-adjusted “real” indices are conceptually valuable to researchers, but they are difficult to understand and apply to real-world finances. What inflation index is used? How can we easily calculate the nominal value of a real number back several years? (This is very difficult to do intuitively.) And why should a price be discounted by an economy-wide inflation figure, anyway? These questions point to why all market price indices use nominal figures.
The chart below illustrates this with clarity. Which of these very different indices apply to higher ed? (Education is grouped with telecom here.)
Historical data is available. CTAS has developed a string of historical data calculating Net Cost back to 2007 using self-reported Department of Education (DoE) data. This allows for an acceptably long baseline to assess current trends.
Net Cost is far more Comprehensive than Net Price. Net Price, the mandated self-reported figure, excludes almost half of students from its calculation in practice (only 57% of entering students were included in the latest 2018/19 DoE figures, to look at one year). The students excluded also happen to generally be the highest paying ones, which artificially depresses Net Price. Net Cost is more comprehensive than Net Price.
It is Consumer oriented, calculating costs like you would in any other commercial transaction. Government and institutional aid is deducted from Net Cost. All loans are excluded from consideration. Net Cost represents what the student must pay, either now or later on as a loan repayment.
What are its drawbacks?
It only uses data for entering students, not those further along in their undergraduate careers. DoE reporting requirements leave a gap and prevent what would be a desirable extension of the metric into later classes.
Average Net Cost consists of a single number and does not account for extensive price discrimination conducted by colleges in setting prices. But an index needs to be simple. Average Net Cost relies on an institution’s Title IV compliance reporting along with some proprietary adjustments. This single number is useful to students and to institutions (all businesses price discriminate and all pay attention to net realized price). CTAS is engaged in an ongoing projection of college costs across income tiers but the methodology is somewhat different from the Average Net Cost calculation and the results are of course more complex.
Certain students will not find Net Cost particularly relevant. It does not apply directly to everyone. That is the liability of simplicity. For example, a commuter student enrolled part-time in a 2-year college will not find the number particularly relevant. For that student, the straight tuition by credit hour represents the incremental cost of their program. Net Cost also applies to US students only and excludes international students. But the reluctance to simplify results in a fog of confusion and reluctance by consumers to purchase the service.
Finally, the methodology in calculating the number is not always straightforward, although we attempt to make it automatic wherever possible, so as to maximize consistency. Factors like in- and out-of-state enrollment ratios, estimates of off-campus residence costs and data reporting errors all require adjustments and intervention.
We look forward to presenting more detailed information on college economics using Net Cost. It is a single number, can be directly understood as a consumer purchase price, and will clarify the pricing dynamics in the undergraduate marketplace to allow for efficiency and point to potential price increases by colleges.
You can also find this piece and others at the CTAS website.


