

Introducing the 2021/22 working project on college costs
Introducing the 2021/22 working project on college costs
The working report forecasts costs of ~3,000 colleges along with state indices
The CTAS working report on forecast 2021/22 undergraduate program pricing is now available to members. The report projects Net Costs for the upcoming academic year for almost 3,000 institutions, including all 2- and 4-year colleges with enrollments above 1,000 full-time equivalent students (FTEs). It shows forecast price curves for in-state tuition organized by state by student family income based on historical college data and reflecting the US economic barometers that drive overall pricing across the industry.
Intended to provide higher ed professionals, researchers and government officials with a more transparent and convenient way to track competitor pricing and overall industry trends, it will help illuminate the intensely price-sensitive market for undergraduate education. Because of the complexity of college pricing practice, this report is termed a "working paper", a report making progress towards a goal. There is no doubt that some of the numbers here will need to be corrected, both due to quality issues with historical data and because of future unanticipated economic changes. To help us do this, we encourage you to provide feedback to workingproject@collegetuitionadvisoryservices.com . CTAS intends to make its numbers as accurate as possible, so we welcome your input and will work with you to resolve questions.
The curves are compared to family income of entering students, as mentioned above. The student financial axis is solely based on income because analysis of past trends shows changes in college costs and family income are tightly correlated. In the 2010s, 4-year colleges had a weighted average price that hovered close to 21.5% of the US Census metric for Median Family Income for families headed by college graduates aged 25 or over. The relationship of prices with household assets, wealth, inflation and GDP were weak to nonexistent, by comparison. Overall college costs (including both 2- and 4-year programs) also was tightly correlated with Median Family Income for all families for all educational-level attainment, at an average ratio close to 26%. Both relationships passed statistical tests and met qualitative look and logic tests. Families decide on what they can afford to pay through the clearest evidence of their financial situation, their paycheck, and ignore the complex and obscure asset ratio test.
This report uses Net Cost to measure prices. Net Cost is a consumer-centric metric which shows costs as they are presented in commercial transactions outside of higher education. It represents a full-time student’s cost of attending college including: tuition, room & board, fees and estimates of supplies less institutional aid of all kinds (including need-based and merit), and less federal and state/local aid. Loans and other repayable amounts are excluded and do not reduce the cost. Room and board charges are on-campus costs for residential colleges; for students attending non-residential institutions, the college's own estimate of such off-campus costs is mostly used. Net Cost differs from the Net Price figure self-reported by colleges to the NCES because it is comprehensive and covers all students, including the over 40% not included in Net Price calculations. Input into the report comes from several different directions, including IPEDS, and proprietary projections based on macroeconomic indicators along with geographic adjustments. Correction of data quality issues in IPEDS is made and differing numbers from different sources are reconciled. This is an ongoing effort and represent a forecast so changes to numbers are to be expected.
In addition to the ~3,000 colleges covered here, CTAS has also assembled state averages to show comparative pricing. The example below shows a sample of in-state costs for Rhode Island.
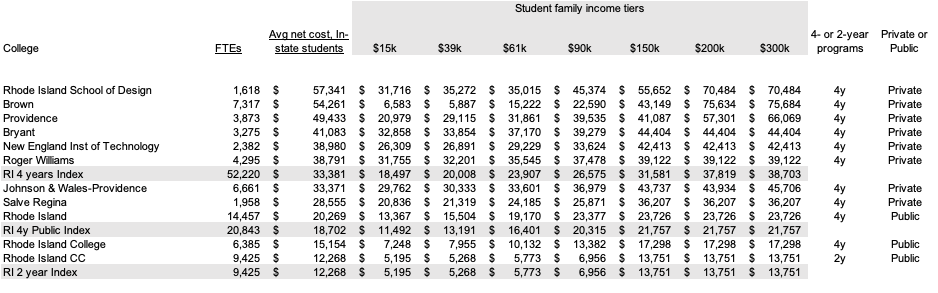
Along with institutional designators, the report shows projected 2021/22 full-time equivalent student and projected Average Net Cost for all in-state students by student income tier. Because Rhode Island has one 2-year community college (CC), the index is identical for the state, but ‘RI 4 years index’ is a weighted average for all 4-year institutions in the state. Indices are weighted by an FTE enrollment projection, which is based on a proprietary model that will be introduced separately.
Future additions to this report will include estimates of public college out-of-state pricing, comparison of selective school pricing and estimates of cost discounts related to GPA and the increasingly irrelevant SAT/ACT board scores.
The reports can be found at our website. Membership is required so please join here at an introductory price.