Latest inflation statistics: tuition inflation slows to +1.3% in 2023
Low tuition growth v general economy-wide inflation of 3.1%
With the COVID-related uptick in general inflation beginning to subside, we can now begin assessing how it has affected college tuition with some perspective. The latest Bureau of Labor Statistics (BLS) data on consumer inflation breaks down consumer inflation by components, showing 1.3% tuition inflation for the 12 months up to November, compared to 2.3% in 2022. The general price index, as you may have seen in news reports, fell from 7% to 3%.
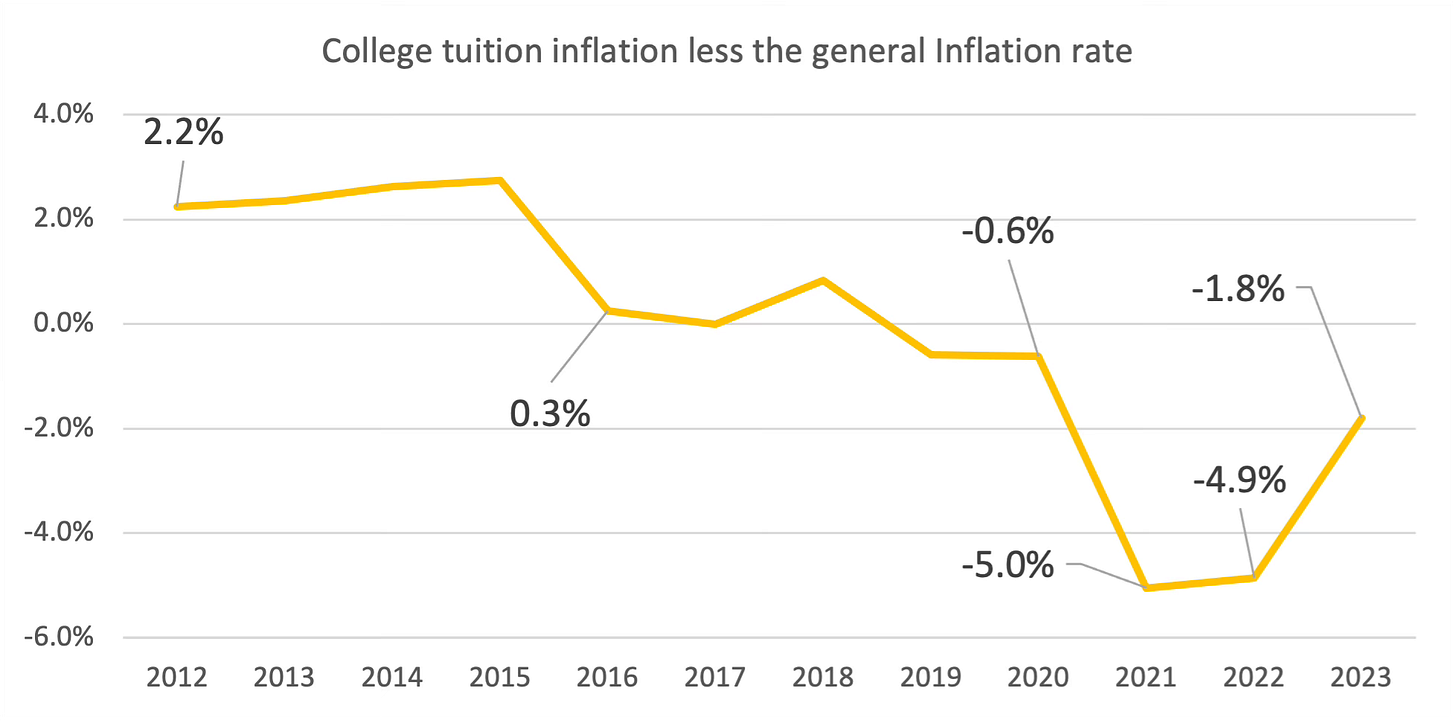
The numbers are surprising – colleges were barely able to raise their prices despite fairly forceful upward pressure from their expense base. And while the inability of colleges to raise their prices faster than inflation is now firmly established as a new environment very different from the rapid price increases before 2010 that are so etched in everyone’s memory, the pattern after 2016 shows a new phase, where colleges are unable to match general inflation, let alone exceed it. This industry-wide trend provides the underlying cause of by-now common reports of budget cuts and departmental closings at a diverse collection of colleges.

The second chart below shows the divergence between the general inflation index and the tuition component, just the difference between the two data series in the chart above. The divergence in 2021 and 2022 was so wide as suggest severe budget issues for higher ed were impending; one piece of good news to emerge from November’s data is a narrowing of the gap. If the trend persists, we can see colleges begin to cover the inflation they experience in their costs with tuition increases that are approximately equivalent.

How do these inflation figures compare to how much Americans are earning at work? The most recent figures from the BLS employment cost index showed growth of 4.3% in wages and income. (This report dates from late October, slightly before the CPI report and represents the annual change over 12 months.) With wage income representing a significant piece of the Expected Family Contribution calculation (EFC, now the Student Aid Index), one would logically have expected that 4%+ growth to feed into college pricing. Just like in 2022 – when a link failed to materialize – 2023 again saw this fairly robust wage growth fail to support college pricing strength. The disconnect between the traditional EFC — whose biggest component are wages and work income — and actual market pricing for college is diverging further. This data solidifies the position that market pricing – as opposed to statutorily-determined financial need - is becoming more and more important in tuition price setting and financial aid.
Because roughly 3 / 4 of US undergrads attend public universities, it’s difficult to imagine how this price/EFC disconnect would spring only from private college students. So market pricing apparently is becoming more extensive in the public segment.
The budgetary impact of slow tuition rises can be mitigated by enrollment gains. The good news is that undergraduate program enrollment is stabilizing, as seen in the most recent NSC data, with 0.9% growth in enrollment reported in the Fall of 2023 v 2022. The community college sector did better, though they only partially recouped some of the dramatic loss of students during COVID. Putting together 0.9% enrollment growth with 1.3% inflation, we see tuition revenues climbing a bit over 2% this year, below both the general inflation and wage growth rates. Putting the enrollment and price trends together, higher ed is doing sort of ok, but one positive takeaway is that 2023 looks to have been much better than the very worrisome COVID period, when both enrollment and price trends were just plain bad.
This growth is consistent with the revenue projections for 2024 from the two major higher ed ratings agencies:
Fitch Ratings just issued their latest projection in November, estimating tuition revenue growth of 2-4%, which will “constrain operating margins this academic year”. We think the lower part of that range is likely.
Moody’s report, issued earlier this month, is more optimistic than Fitch, projecting 4% sectorwide growth, including non-tuition items. Of course, federal and state government higher aid funding packages can have a big impact on overall institutional budgets. The Moody’s report is restricted but a brief press account can be found here.
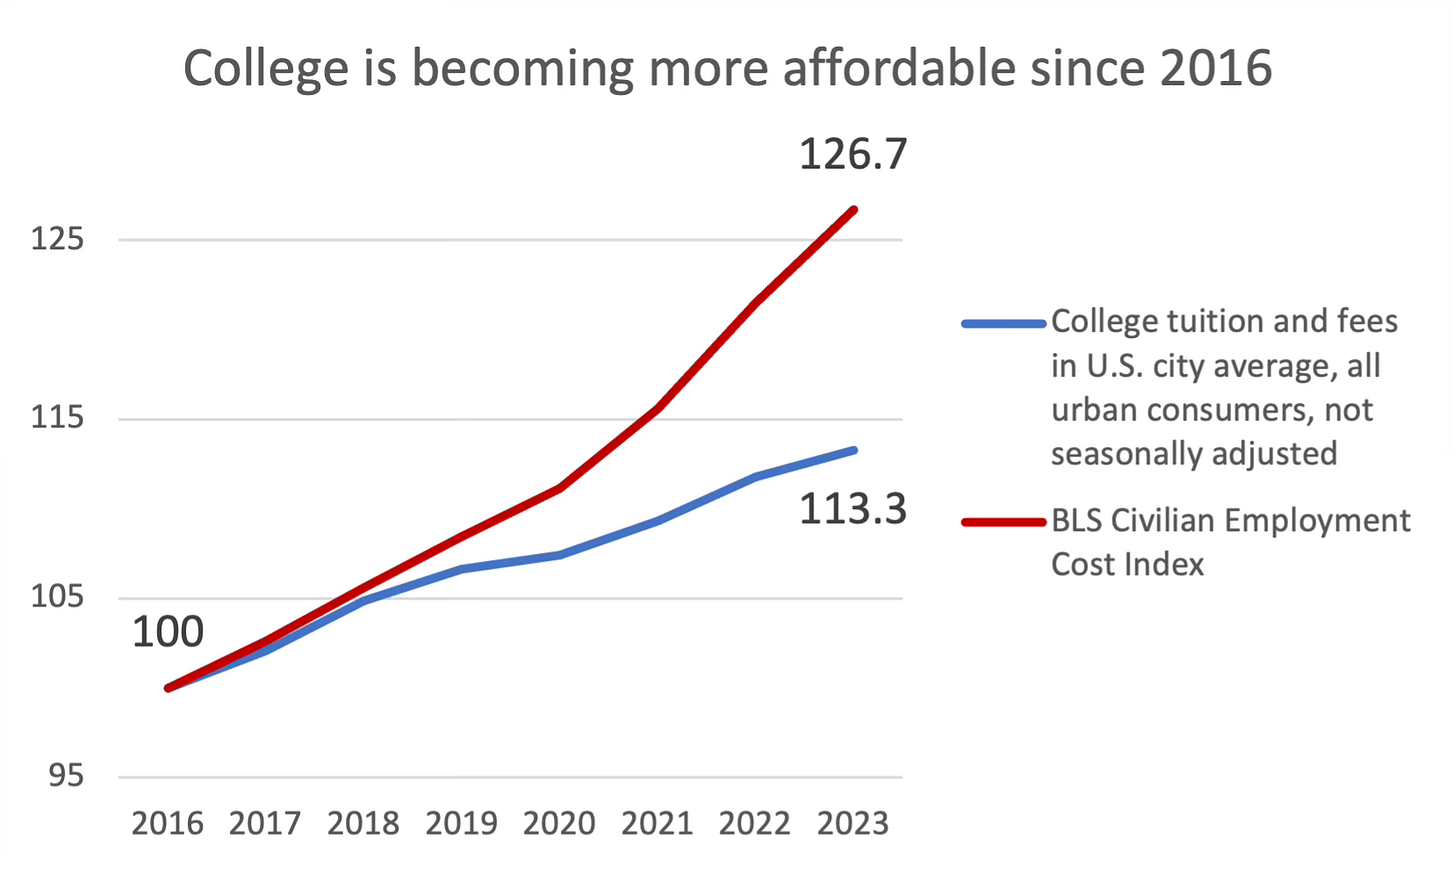
Bending the cost curve: The flip side of pricing and budget pressures on colleges and universities is that college is now becoming more affordable for students and families. Since 2016, this has been happening:

From 2016 through 2023, the general US population has seen compensation increases of almost 27%, while the comparable costs for undergraduate programs have increased a much smaller 13%. Of course, compensation is a much higher than tuition, so it means that the 27% increase is over a larger base and that it represents an even larger improvement in affordability than the chart shows.
If we look at the same index back to 2011, the same pattern holds: worker compensation has increased faster than college costs both since 2016 and since 2010. 2023 continues that trend - in fact, the gap between the two was particularly large in the most recent year - so we can state with some confidence that college affordability is being improved, via market pressures.
The BLS Employment Cost Index is just one of several government indices tracking income growth. Two other prominent indices are the Social Security Administration’s Average Wage Index (AWI) and the Federal Reserve Bank of Atlanta’s Hourly Wages Tracker (Fed HWT). Both of those actually show higher income growth for US workers than the BLS index used in the chart above. The AWI reported an increase of 31% (2016 to 2022) while the Fed HWT index reported an even higher increase of 34% (2016 to 2023). This indicates that college affordability is improving even more rapidly than the widely-used BLS index shows.
Because the bulk of college inflation occurs in August, September and October -- logically, when most students begin their academic years and new prices come on line – this blog has been covering the BLS inflation releases after the statisticians have had a chance to release and then revise the October results. While further revisions of the 2023 data will certainly occur in coming months, changes are likely to be modest so we can broadly conclude that the 2023 results show higher ed stabilizing after a rough 2021 and 2022. Despite that, slow moving long-term trends are not particularly positive.
CTAS supports families and the educational professionals counseling these families with integrated college financial aid, pricing, funding and financial planning advice to help them shape their futures with direction and agency.


Very important data - thank you for finding it and presenting it so clearly.
College has become more affordable since 2016? Really?