More on the 568 Group Class Action
Some statistical evidence that the 568’s aid formula raises prices
In our previous post on the recently filed class-action price-fixing litigation launched against the 568 Presidents Group members, we had noted that some highly selective institutions were in the group and some were not:
Some financial analysis led to these observations:
Using our data, we found evidence that the 568 Group need mechanism did increase net costs and decrease levels of aid vs highly selective competitors. This is consistent with statements from Harvard and Yale admissions personnel cited in the plaintiff’s filing.
More definitive analysis requires multiple acceptances for a given student at both 568 and non-568 schools, with sufficient numbers of such matched acceptances to allow for a valid conclusion. We obviously don’t have this data. Instead, our look at average net cost trend lines is suggestive but not definitive.
Cost comparisons
We used Average Net Costs for this analysis because it covers all entering students, unlike Net Price, which covers the fraction that received aid of some type. As we write in our prior piece on this suit, IPEDS Net Prices for highly selective colleges are particularly deceptive. For example, in 2019, Brown University’s Net Price was calculated using 39% of the entering class, with the remaining people, including all the higher-paying students, excluded. Moreover, need aid formulas not only calculate how much students receive, but which ones receive it, so a comprehensive measurement covering all students like Net Cost is needed.
What do we see? Let’s start with the 10 most selective colleges in 2019, with 6 in the 568 group, and 4 out of it. These schools, with their big names, have similar enrollment practices and large endowments.
$ figures are Average Net Cost. Stanford, Harvard, Princeton and Pomona out of the 568 Group. Columbia, Yale, University of Chicago, MIT, Brown and CalTech in 568. The average is simple (not weighted by student body size) because institutions are being compared, not the aggregate impact on students.
The colleges in 568 cost more to begin with and raised their Average Net Cost by 32%, while those outside of it raised prices by 22% between 2010 and 2018.
We can also compare the 12 colleges right behind these in selectivity.
$ figures are Average Net Cost. Swarthmore, Bowdoin, Colby, College of the Ozarks, Claremont-McKenna out of 568. Duke, Penn, Dartmouth, Rice, Northwestern, Vanderbilt, Cornell in 568. The average is again simple (unweighted).
The colleges in 568 cost more in the beginning of the period, like in the Top 10 category, and then proceeded to raise their Average Net Cost by 23% between 2010 and 2018, while those outside of it raised prices by just 13%. The colleges in the group are not as homogenous as in the Top 10 - the 11-22 ranked schools in and out of the 568 Group are quite different - but the 10% differential between members and non-members is similar both in the Top 10 and the next 12. This isn’t conclusive evidence that the 568 formula lowered aid amounts - we want to be careful - but it is very suggestive.
As always, the starting time point of any analysis is absolutely key. We used the 2010 to 2018 time period because it begins after the Great Recession had made its huge impact. But the pattern persists during Great Recession as well. Just to look at the Top 10:
Same comment as the first chart. This chart and the fall in pricing levels of Harvard, Princeton and Stanford in 20008-10 were revised since the email distribution of the post, due to a data correction. The revision affected the magnitude of the changes but not their direction or the ultimate conclusion.
The colleges in 568 raised their Average Net Cost by 26%, those outside of the group had increased their prices by 17% between 2008 and 2018.
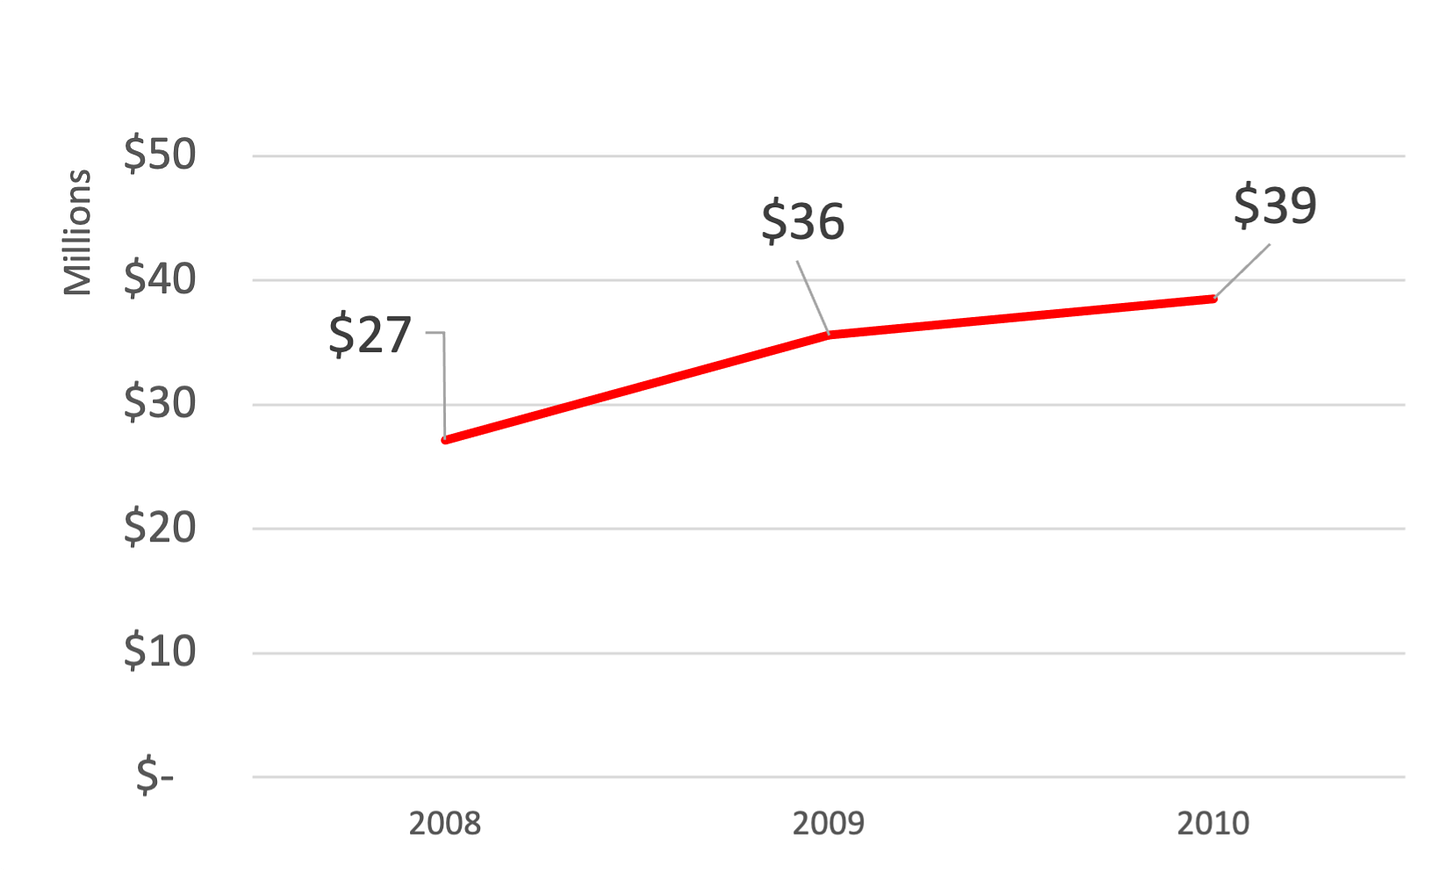
The chart above shows that the Great Recession forced the 3 most selective non-568 institutions - Stanford, Harvard and Princeton - to significantly increase their aid levels. These three schools cut their average net prices - their true costs - by 7% in the course of just two years (2008 to 2010). This is also reflected in the raw reported data, before any analysis. For example, Harvard’s financial aid budget for these years:
With its enormous endowment, Harvard could easily afford this, but this illustrates how the Great Recession deeply altered higher ed economics.
The other point is that non-financial enrollment strategies have an impact on Average Net Cost. For example, Yale (a defendant in the 568 suit) has been very clear about trying to enroll more lower-income students. Their financial aid budgets show that this isn’t just talk:
Between 2014 and 2018, the Average Net Cost paid by Yale entering classes went up a total of 0.6% (total, not annual). Because this was in a time where Yale’s Cost of Attendance went up significantly (20%) and the fact that Yale doles out little merit aid, the data illustrates the results of the university’s low-income student recruitment, with many more of these students attending.
As one of the 6 universities in the Top 10 selectivity rankings which were in 568, this enrollment strategy change has a meaningful impact on the final averages and would have decreased the disparity between the 568 and non-568 schools. In the second chart, the 568 and non-568 colleges are different in model and character, something which is especially true of the College of the Ozarks, a highly selective small school that pursues a very different enrollment and financial strategy from a university like, say, Vanderbilt. The averages are generated by sets with some anomalies and confounders, so again we want to underline the results are only suggestive.
Takeaways
The quotes in the class-action filing tying less financial aid to the 568 Group need formula in the class-action filings are supported by our financial data.
This financial analysis is suggestive but not conclusive.
Averages for entire entering classes are affected by recruiting strategies.
The impact of the Great Recession on the Ivy League school tuition revenue was significant. Those Ivies don’t care, but it has implications for less rich institutions that we will explore in the future.
Read this post and others at the CTAS site.


