Retention Wrap-up
Free reports now available; a look at drivers of retention improvements
Wrapping up our series on college retention - the percentage of students entering a college who remain there a year later - its highlights include:
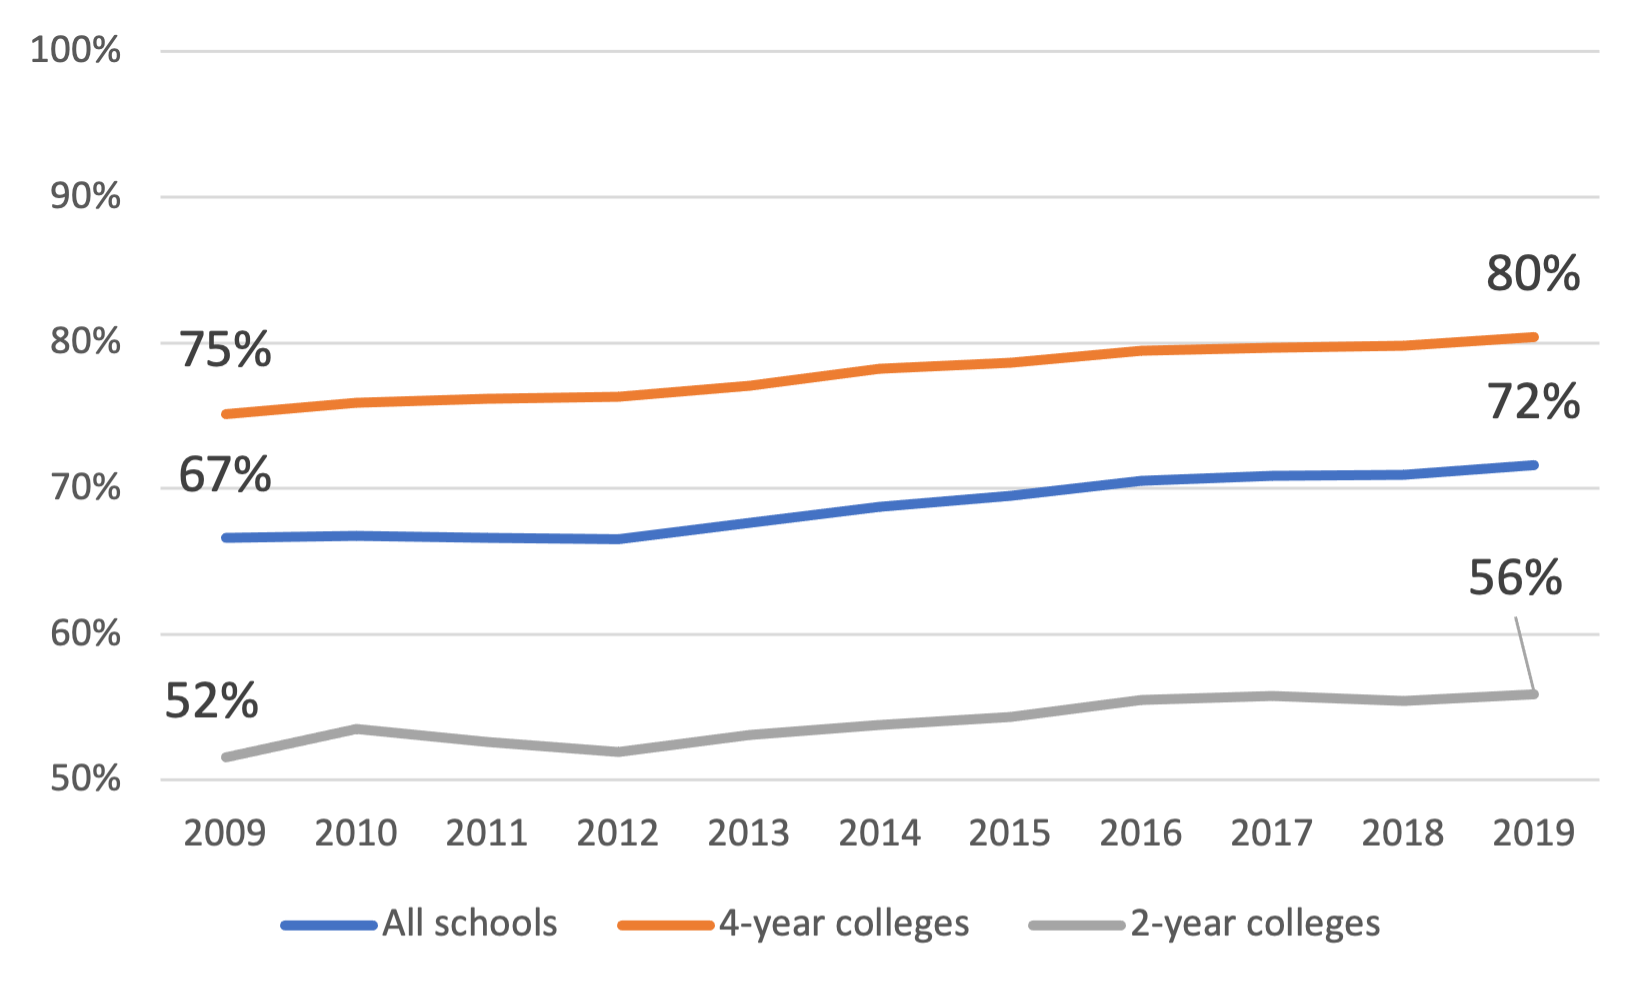
Students returning for a second year increased from 67% to 72% in 2019 across all US undergrad programs. We will look at the some high-level drivers of this rise to see whether colleges are improving, students are switching to better-performing colleges, or data is being manipulated.
Students who begin an undergrad program full-time are much more likely (76% in 2019) to return than part-timers (45%).
Falling retention rates and climbing admissions rates are often signs of organizational and financial problems. . We looked at certain schools - University of Alaska and Illinois State, to take two - where the results indicate significant business issues. But others - San Jose State, Appalachian State - generate retention numbers that indicate outperformance.
Certain major onlines have appallingly bad retention numbers. One of those is Ashford, the college that was just acquired by University of Arizona. Two of the largest national onlines, Western Governors and American Public, report solid results, but those are calculated using a tiny sample, not the full cross-section of its entering classes.
Replaying a theme seen across higher ed, retention shows that students prefer big campuses. The big schools started off the decade with better retention numbers and improved more than smaller schools.
Retention data for 3,500 schools now available
Reports showing retention data by individual college are now available for free at the CTAS website, as part of this series. The reports are organized by state and show retention averages for the periods from 2010-14, from 2015-18 and the 2019 numbers most recently published by the Department of Education. The Access directory page can be found here. A search function is available within the reports to find specific colleges.
What are the drivers of the improvement in retention - colleges, students or measurement?
As mentioned, retention of students into a second year had improved to 72% of entering students in 2019:
Possible causes of the improvement are:
College performance: Colleges are on average getting better at enrolling and satisfying students, leading to higher retention.
Student choice: Colleges with low retention figures are losing students to colleges with higher retention.
The figures are being fudged.
All three of these play a role in the improved retention results.
Colleges improving retention: One way to quantify how much colleges themselves are getting better at this is to hold student entering enrollment constant across years. With no changes to where students choose to enroll, will the averages across the 3,500 colleges included in the retention analysis improve? The answer is yes: colleges are enrolling better prepared students and are providing increasingly satisfying service.

Students shifting to colleges with better retention: The second possibility is that students are shifting to colleges which retain more first years, ones performing better in terms of students preparation and satisfaction. That is also occurring:

Data fudging: The IPEDS results being analyzed are unaudited, it always bears stressing. In our experience, the main way higher ed data is manipulated is by altering what data is included: if a group of students underperform on a given metric, they can be omitted from the results. This practice is difficult to catch absent a full-blown audit, which isn’t going to happen. Is there any actual evidence that this is occurring with respect to retention? One sign would be how large the sample of students measured for retention is compared to some first-year enrollment metric and, in fact, there is a fair amount of variation in the students sampled.

The 2018 figure is not that different from 2009 but, after 2011, the proportion of students included in counting retention declined by about 1/10 of the entering full-time class. Because this is a broad industry composite measure, no blame or fault is being cast on any individual college here, but the US broad average showing a retention improvement uses a less thorough data sample than 7 years earlier.
Assessing the overall impact of this sample size decrease is difficult because we literally have no visibility into the group of students left out. If those excluded students were disproportionately part-time, the decline in the reported sample from 114% to 105% could conceivably have increased the overall retention rate by ~3%, about as large as the entire college portion of the retention improvement. This improvement from smaller sample sizes would be contained within the two increases - college improvements and students enrolling in more successful colleges - described above.
And non-reporting does occur. Miami Dade, one of the nation’s largest colleges with almost 55,000 students, has not reported retention statistics in a decade. (Miami Dade has no role in the decreased sampling above because it last reported figures in 2009.) But a school like Eastern Florida State, a public 4-year with over 15,000 students located east of Orlando, reported declining, below-average retention numbers until 2012 - and then stopped reporting anything. This sudden stop would improve the overall picture. And the non reporting is not restricted to Florida. A group of sizable California 2-years ceased reporting their generally poor retention results in 2015, a change likely associated with the schools’ expansion into 4-year degrees that year. So non-reporting bias can potentially be a meaningful distortion.
Based on the data above, our qualified estimate of the drivers of retention from 2009 through 2019 is broadly:

Colleges making improvements have about the same impact as students shifting to higher-performing college, with an extra sprinkle of improvement coming from data not covering as many students. This breakdown needs to be taken as a rough estimate but it should be broadly accurate.
Final word
What makes for a good college? One answer is that it enrolls the right students who can benefit from the program and that the students themselves like it there, can handle the course content and stay. And students as a group have in fact been shifting to attending schools with better results. The metric provides another way to review college performance and stability and to understand widespread student trends.
Read this report and more at the CTAS website.