

The “COVID” Admissions Cycle
The “COVID” Admissions Cycle
New data for 2020, the strangest admissions year ever
The onset of COVID in February and March of 2020 led to a chaotic admissions cycle, filled with uncertainty. We can now begin assessing the cycle using comprehensive IPEDS data instead of piecemeal information:
Higher ed loosened admissions standards. Colleges accepted almost 61% of applications in 2020, breaking out of the 55-57% range within which the admissions rate had fluctuated had over the previous decade.
Looser admissions were a response to fears of students dropping or deferring their college plans. That perception proved accurate. 80,000 fewer students enrolled in selective schools in 2020 as compared to 2019.
Despite widespread concerns about long-term enrollment declines, both selective and open admissions entering classes had remained very stable in the years preceding COVID. This pattern was broken in 2020.
The term “selective” throughout this post applies to any college that is not open enrollment and has an applications process.
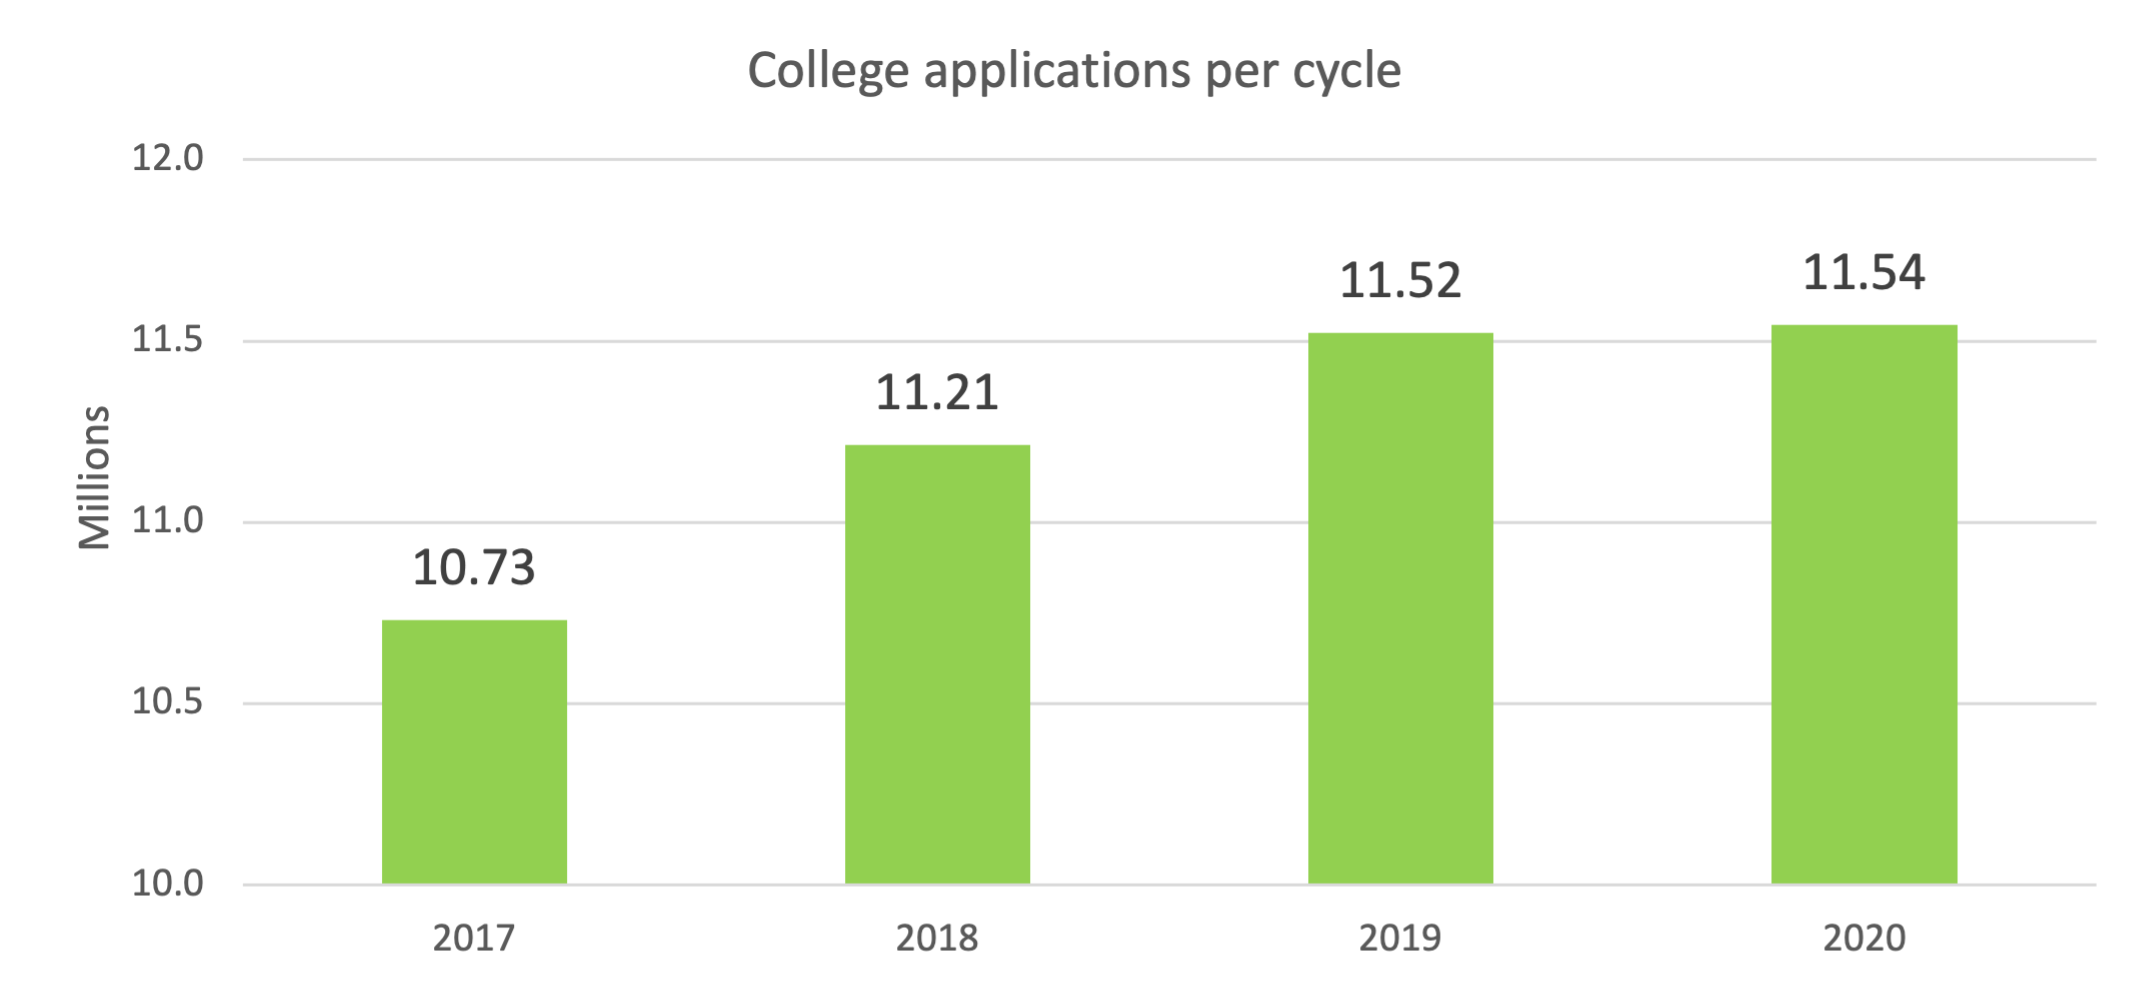
Despite the pandemic, the absolute number of applications in 2020 hit a record high — although year-on-year growth rate leveled off.
Given these dynamics, record lows in yields and record highs in both applications and acceptances per student were possibilities. All three occurred.
Private colleges had been showing enrollment weakness for several years. The 2020 cycle underlined this weakness.
The raw absolute numbers
Before we get to ratios and percentages, let’s look at the raw numbers. 2020 saw a record high number of applications, though the growth rate declined:
Colleges were concerned about the situation and sent out more letters saying “yes” than ever before:

They had good reason for this concern. Both selective and open enrollment schools saw smaller entering classes, with almost 220k fewer full-time students beginning their college careers compared to earlier years (down 9%):
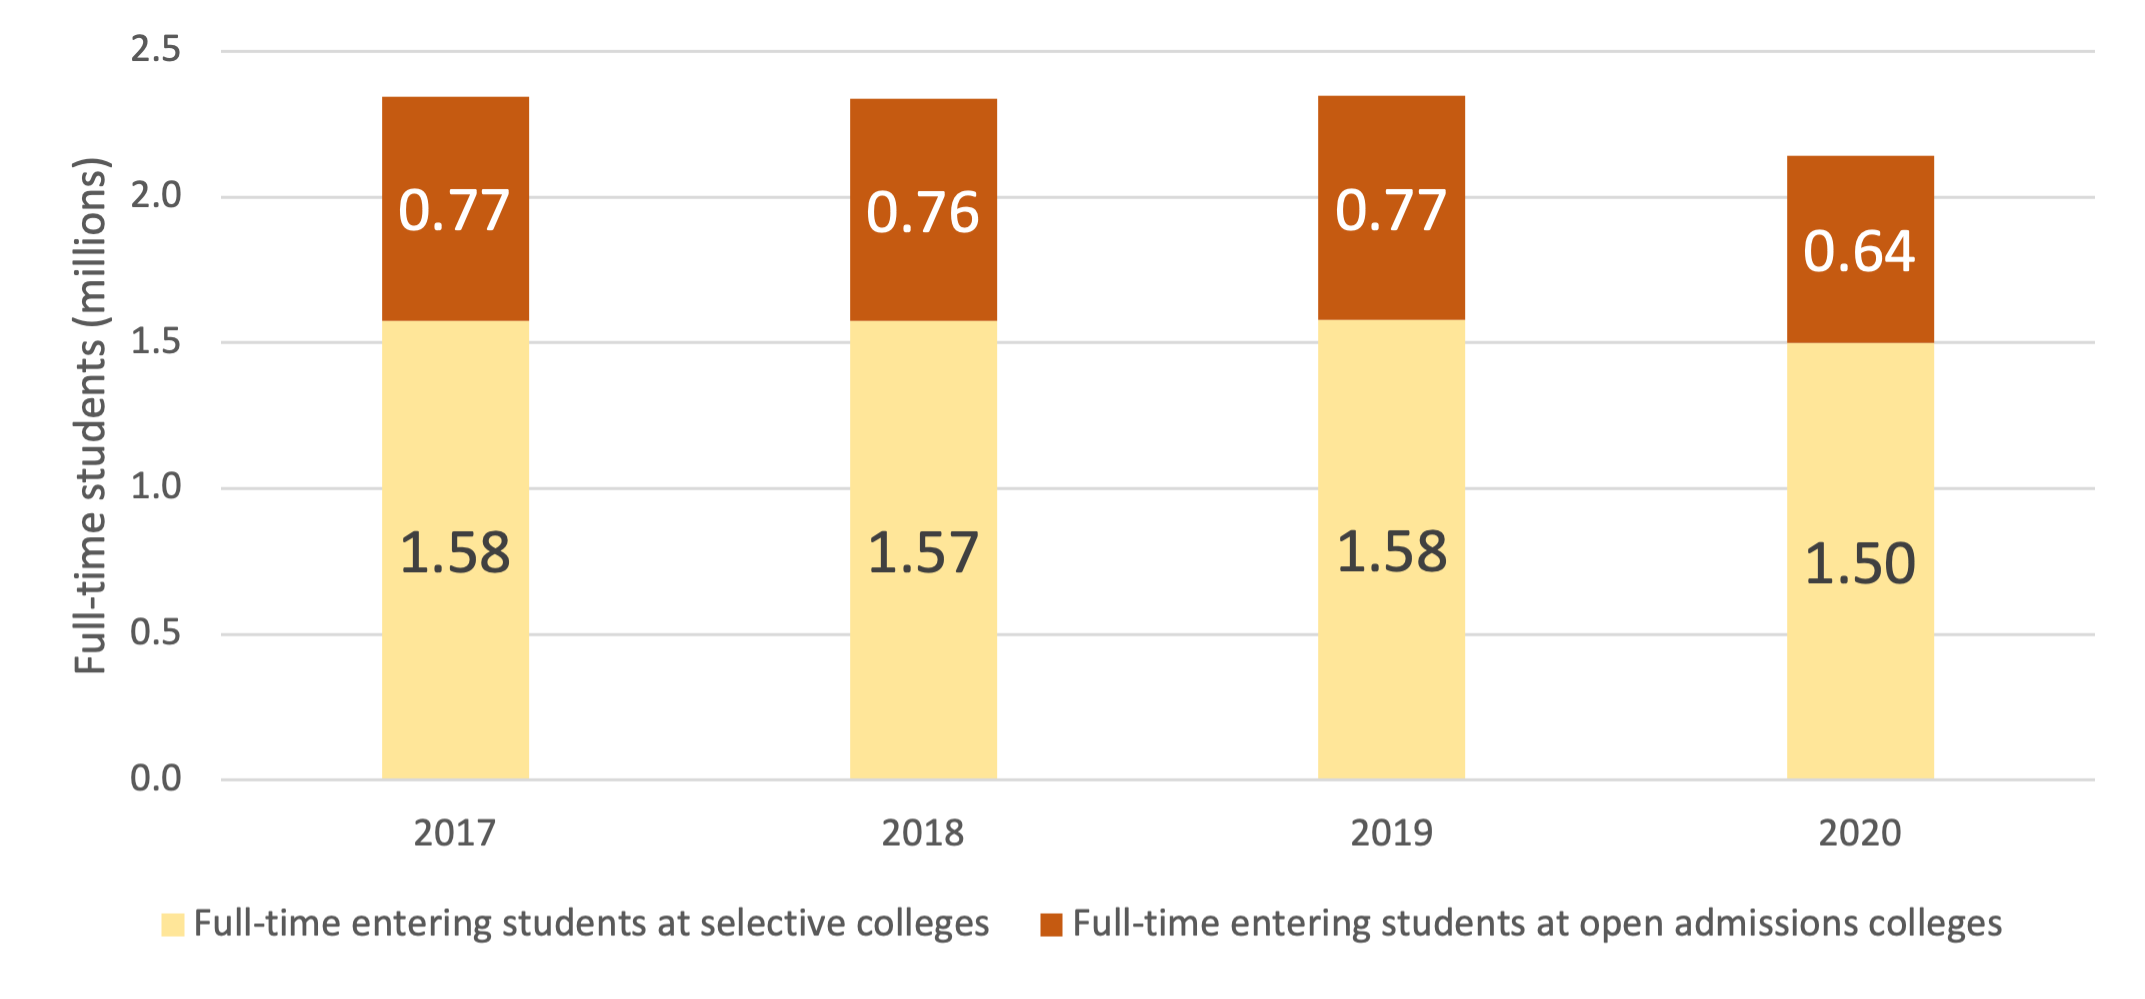
Open admissions institutions were hardest hit, in both absolute numbers and by percentage (down 17%), consistent with reports about community colleges.
Colleges loosen admissions standards
For the decade prior to COVID, selective college admissions had hovered within a tight band. Until 2020:

This occurred in an environment where students apply to more and more colleges:
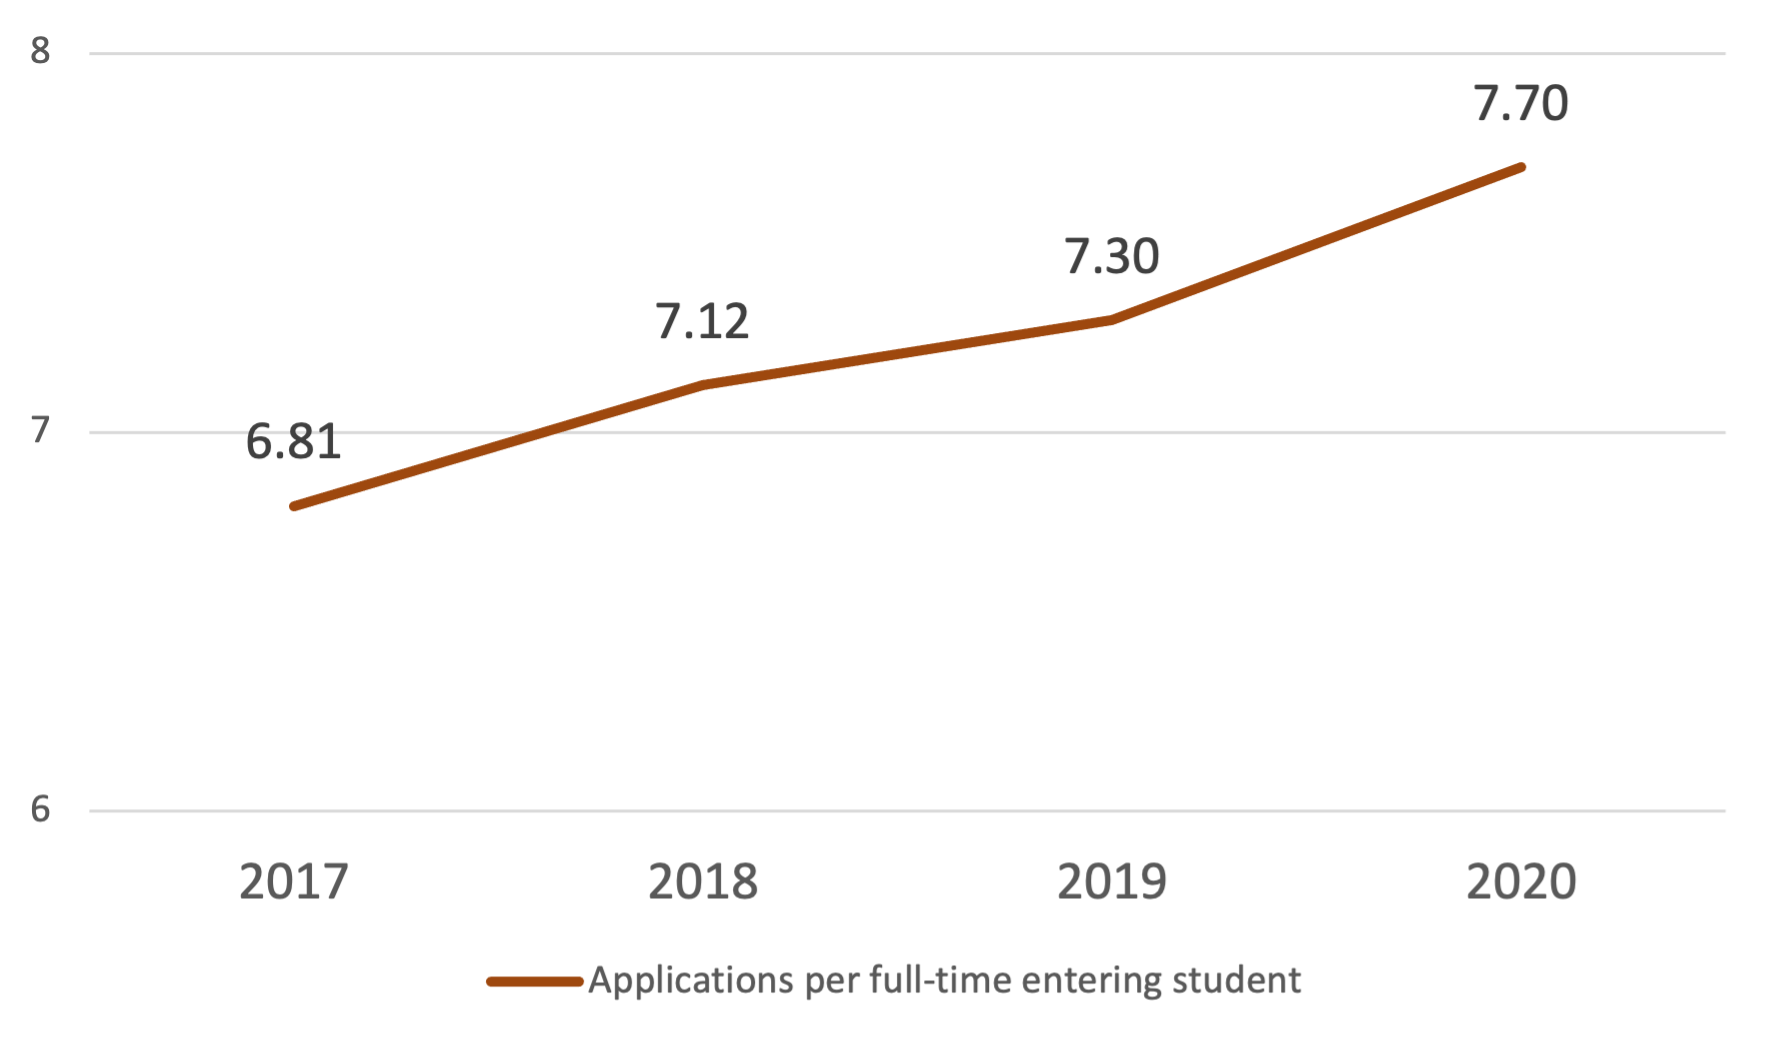
The decline of ~70k in full-time first years entering selective colleges will have affected this ratio, pushing up the number. If we assume that all of those 70k filed an average number of applications - probably an overestimate - the ratio would have been 7.31, unchanged from the previous year. This suggests that the applications per student continued along at more or less the existing growth rate.
This chart above is particularly intriguing. Many applications were filed in the fall of 2019 and first two months of 2020, before COVID’s magnitude was apparent. And the 2021 cycle which followed also showed a growing flood of applications. We don’t yet have comprehensive information about 2021 – only anecdotes – but we’ll speculate that the ramp-up in applications was part of an accelerating trend independent of COVID.
All this naturally pushed up the number of acceptances per student.
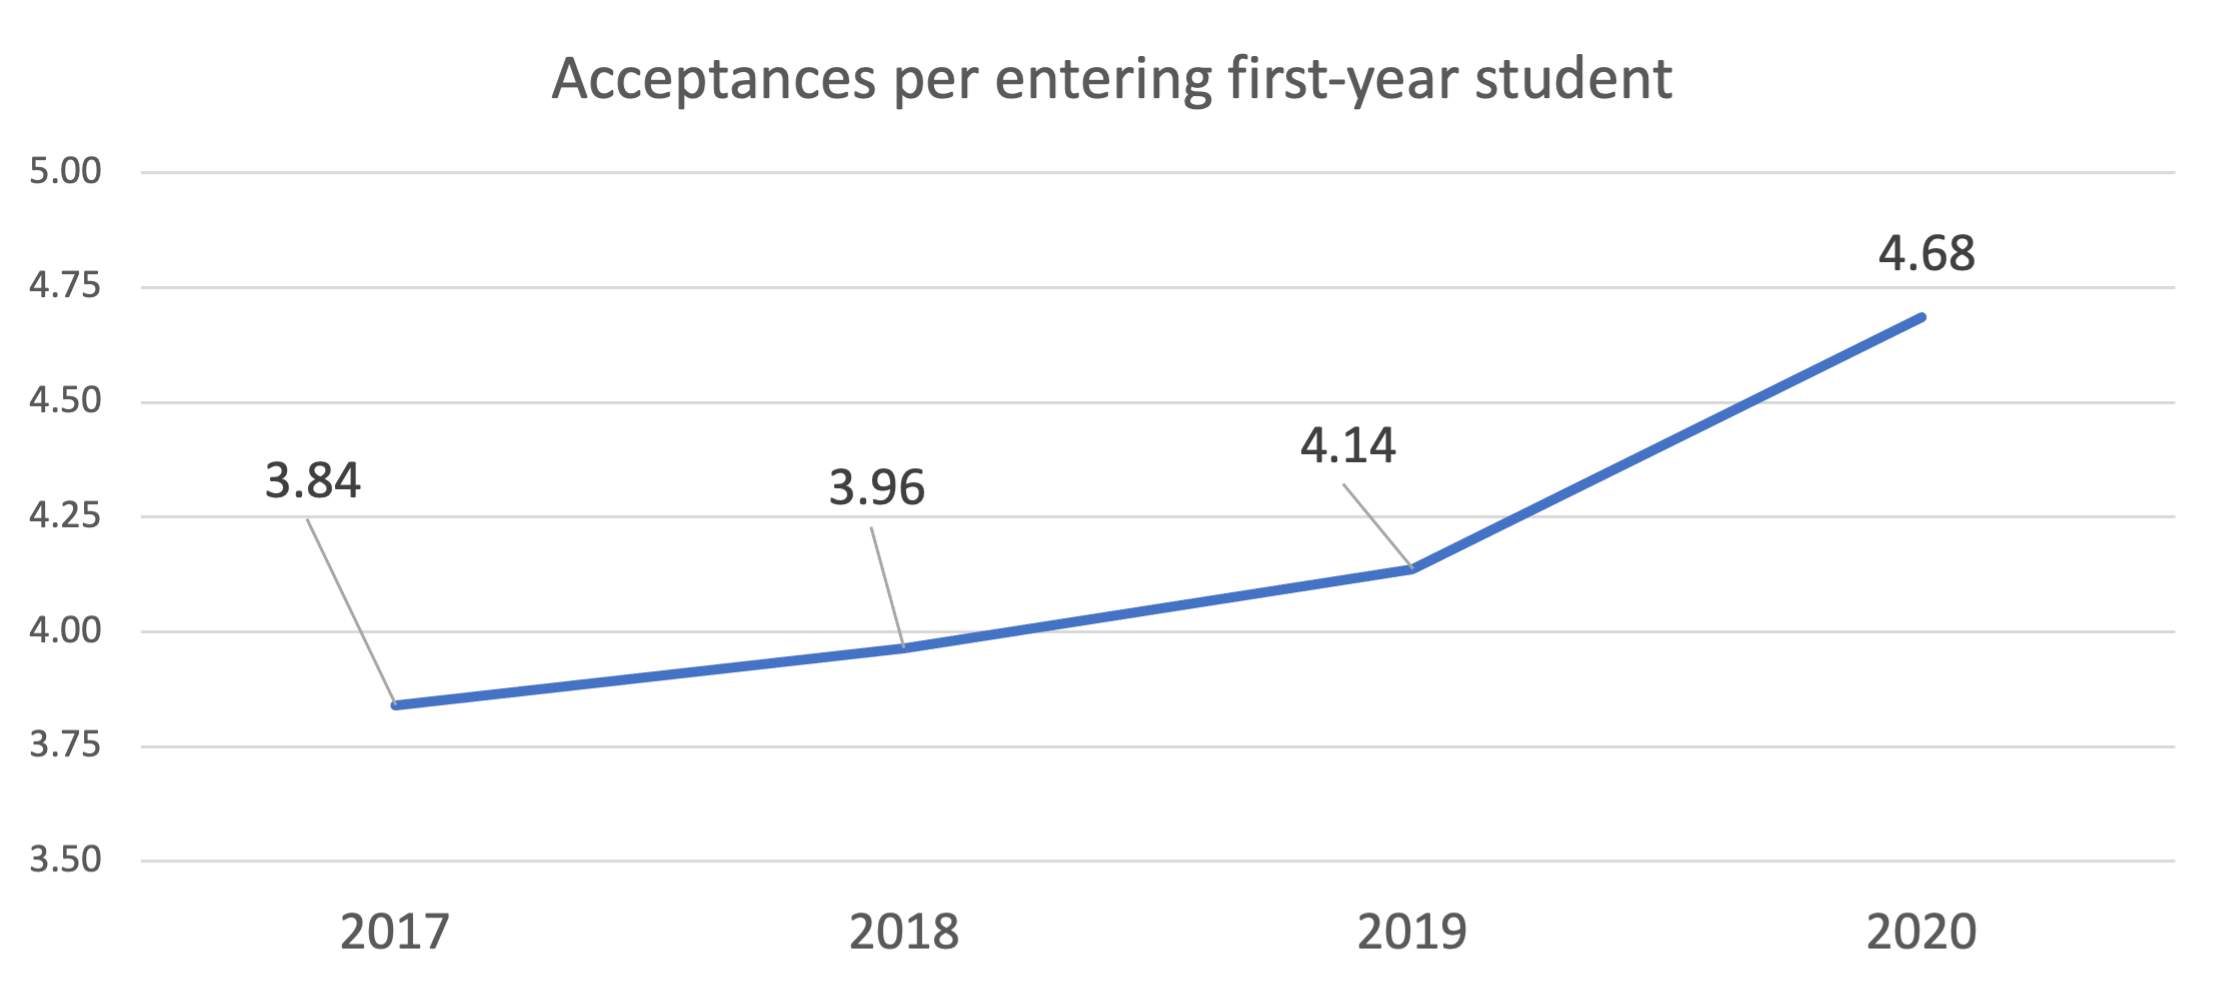
In 2022, it’s not unusual to see students with 7, 8 or 9 acceptance letters, more than the number of applications even dedicated students would have submitted in the first place a few years ago.
This step up to 4.68 acceptances per student is a dramatic change from trends in the preceding decade. In a business with nonrecurring customers (most students apply to colleges once or maybe twice), we’ve argued that the number of acceptances per students is a key channel to get real pricing information out into the consumer base: the more acceptances, the more transparency there is. And transparency in pricing gives students more power to comparison shop, putting downward pressure on pricing, something especially true if colleges are seeing declining – and uncertain - yields:

Again, that’s a step change. For reference, the yield in the 2010 cycle was 34%. How does a college enrollment office manage its business with a yield of 21%? Mathematically, it becomes difficult. One solution is to waitlist applicants actively. But widespread use of wait listing gives students the time and information to comparison shop, on quality and on price. Another solution is to aggressively lock down students upfront, either through expanding Early Decision programs or setting out attractive initial financial aid offers. All of these appear to be occurring. One solution that doesn’t seem to be emerging is using attractive “exploding” financial aid offers.
Overall economics and admissions mechanics
To step back, we have been repeatedly making the case in this blog that the underpinnings of the undergrad market are weak: too many college seats, declining student demand for college, heightening price sensitivity for what is increasingly viewed as a commodified product (the Bachelor’s or Associate degree). (But calling this a demographic cliff is both hyperbole and misleading!) That’s the overall industry environment.
The mechanics of the admissions marketplace are a separate factor, though it exists in the context of the industry environment. Colleges and students are operating within a loop where each technical step in the admissions process is working in students’ favor: more applications and acceptances, more enrollment uncertainty for colleges, more transparency and competition around price, and a calendar with rolling acceptances instead of a single May 1 deadline date. Underlying economics and admissions mechanics both are increasingly aligning to the advantage of students. Nothing in the 2020 cycle contradicts this trend.
Private college weakness
The declining competitiveness of private colleges forms another theme, one mainly true of private non-profits. But enrollment at for-profit schools, with their emphasis on distance learning, provokes questions.
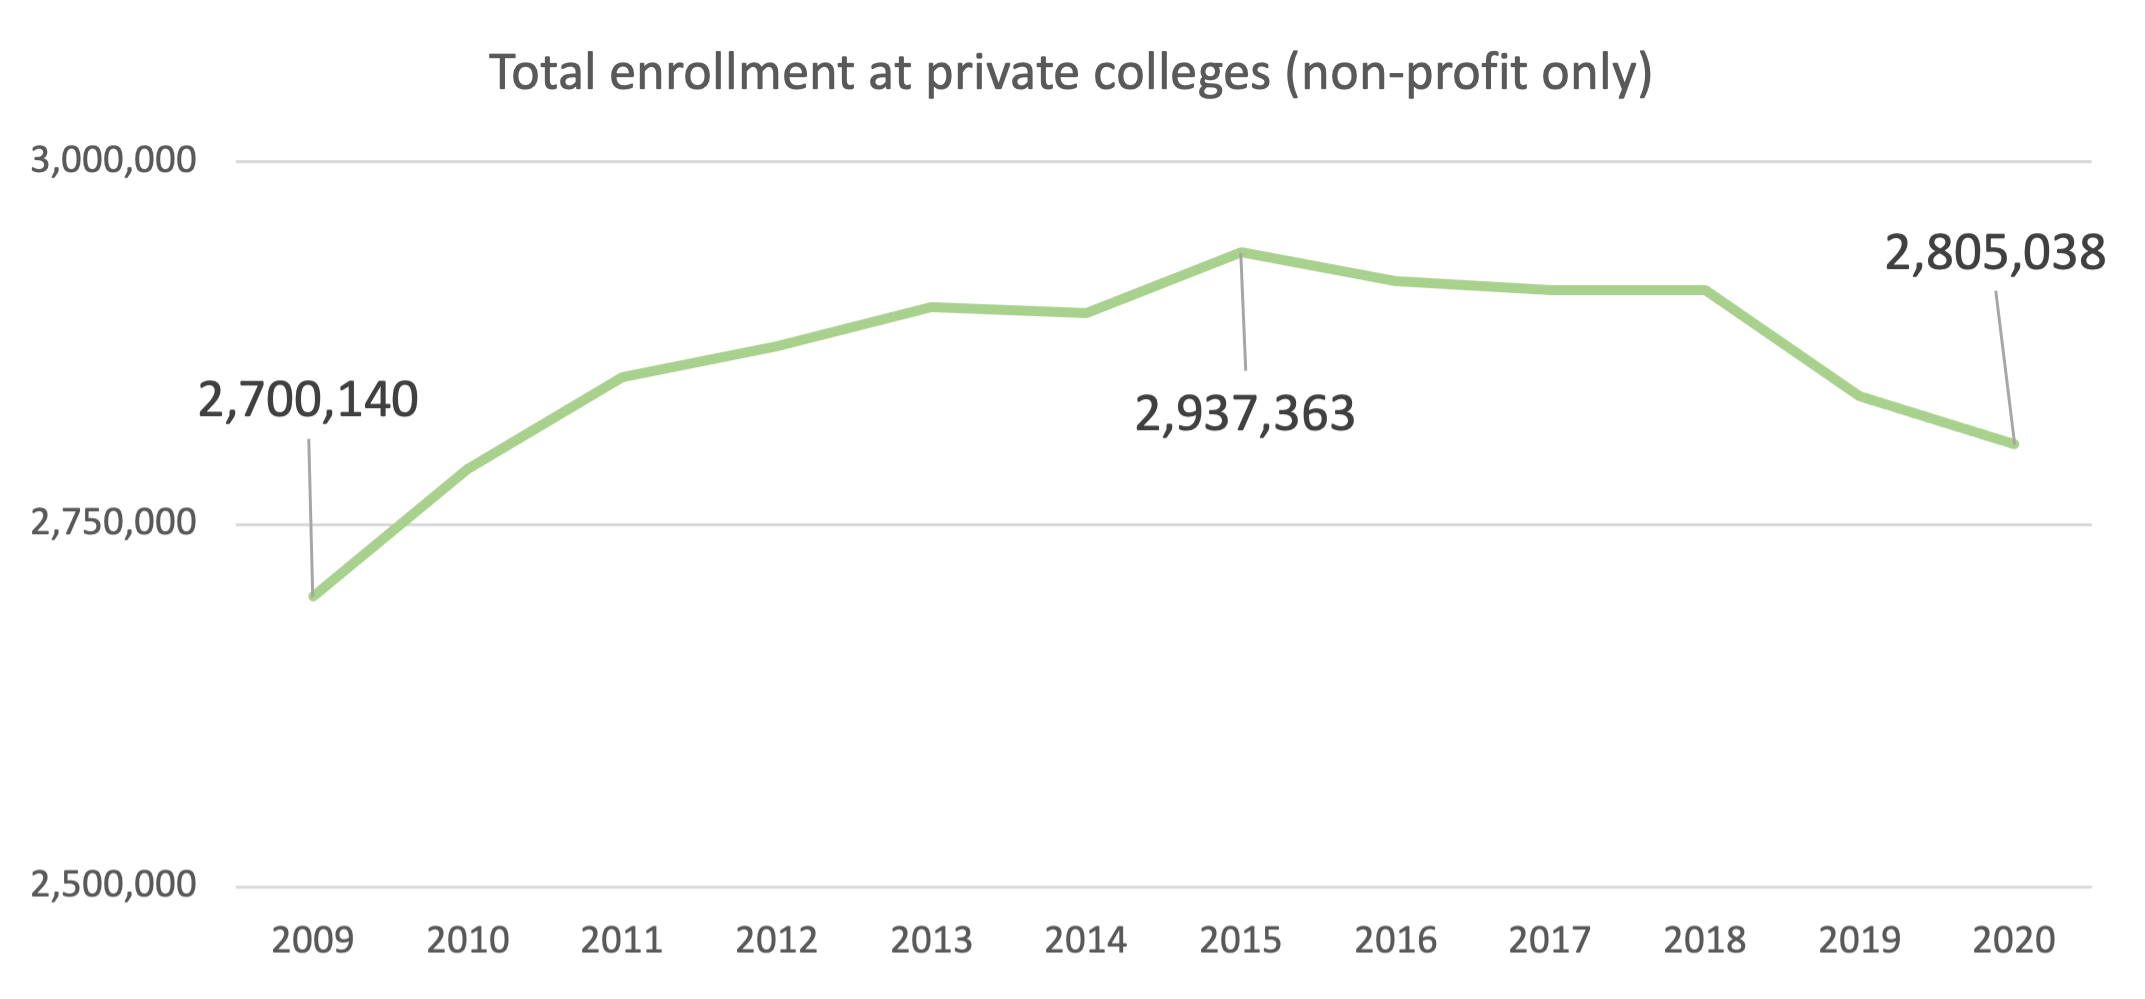
Traditional private college performance can sometimes be obscured by big swings in for-profit school enrollment, which have been on a roller coaster ride in the last two decades, and by press attention given to the prospering Ivy League. If you remove for-profits from the equation, since the all-time high in 2015, non-profit private colleges have been losing students.
The full-time entering classes at these schools reflect the dip, with almost 50,000 fewer first years in 2020 compared to 2017 (both for- and non-profit).

For-profit colleges have endured a brutal decade, losing over half of their undergraduate enrollment. 2020 was the first year since the Great Recession which showed a (very) modest uptick.

This uptick could be perceived as disappointing. Online-centric institutions like Western Governor’s and the Southern New Hampshire notched impressive enrollment gains individually – Western Governors has been growing by the equivalent of a regional university every year – but overall the sector was close to flat. Why didn’t major online schools gain even more students, given the nationwide shift to online learning? And even if 2020 eventually emerges as a turning point for online universities, they need to show quality, not just quantity. Unfortunately, retention stats indicative of that quality - whether the national onlines are delivering a satisfactory educational experience to prepared students - continue to be unreliable. (How is it that a key student satisfaction and success metric - retention - for one of higher ed’s most-watched experiments – national online colleges – isn’t being gathered by the Dept. of Education due to a definitional exemption?) The 2020 data for this category is particularly unrevealing.
Returning to non-profits, the decline in private college enrollments was interestingly mirrored by an actual decline in the raw number of applications to the super-selective Ivy+ group, very much counter to longstanding trends.
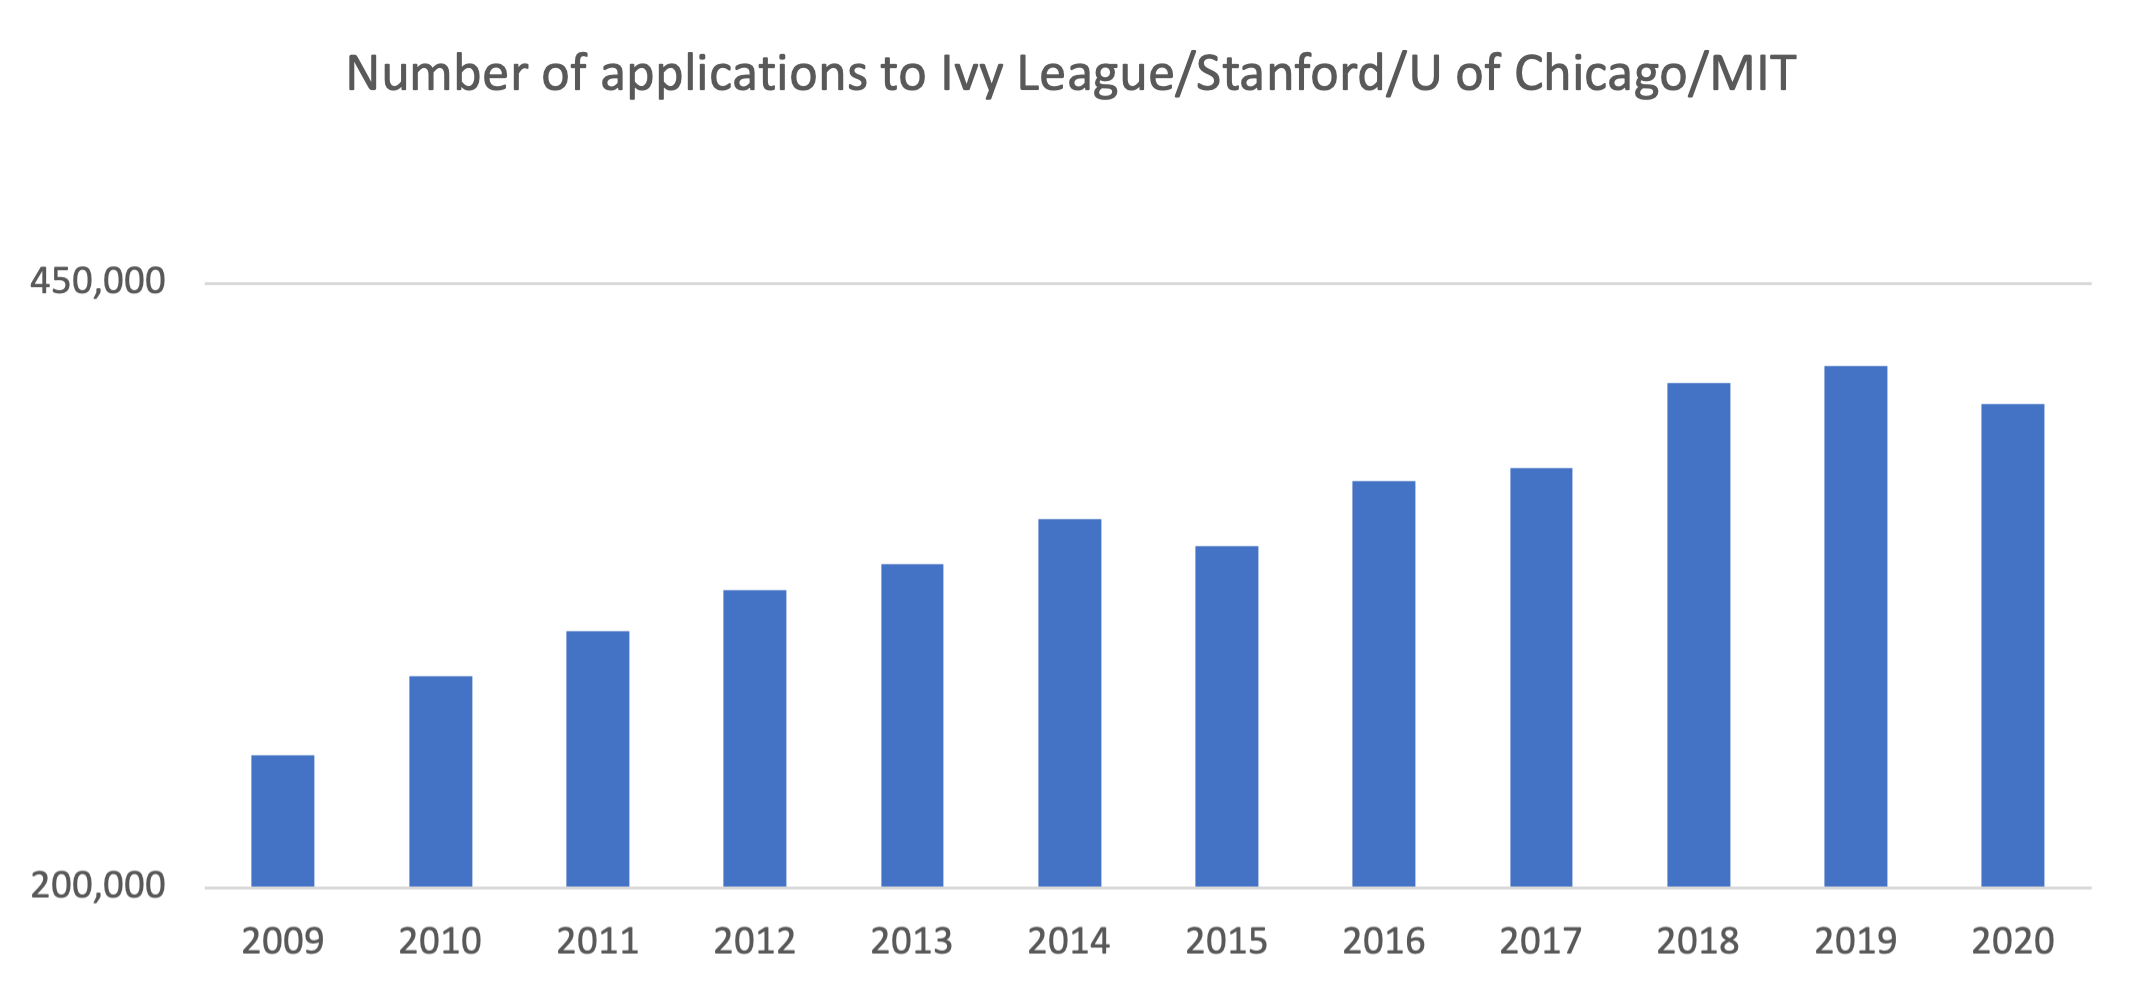
It’s likely that students taking gap years contributed to this decline in the Ivy+ group. In any case, it was short-lived as highly selective schools were inundated with applications in the following cycle.
A COVID blip, a trend — or TBD?
Some metrics from the 2020 cycle reflect longer-term trends:
More applications per student
Declining yields
Some are likely to be passing events:
Declines in applications to highly selective colleges
Significant declines in enrollment at 4-year institutions
And with some, we just don’t know. Trend or blip? It’s TBD until more comprehensive data is released:
Is the higher average admission rate of 61% a new plateau or will the rate revert to the 55-57% range prevalent before COVID?
Are for-profit national online colleges taking advantage of increased interest in online education or is 2020’s increased enrollment just a one-off event?
One big issue that many readers are sure to be watching is falling enrollment at community colleges and whether that will continue. The topic is beyond this post’s scope but a thread from Diane Schanzenbach, a Brookings fellow, presents interesting research on the subject.
Please find more information at the CTAS site. CTAS provides data, reports and personalized assistance with college pricing and aid appeals.