


Undergraduate enrollment in the 2010s
Large and selective colleges saw gains, but it was a rough decade for smaller schools and community colleges
The 2010s began in the midst of a deep recession, with the economy gradually recovering after 2012. The preceding report on undergraduate cost trends demonstrated the weak pricing power held by most, but not all, undergraduate institutions in the last decade. The present study outlines broad themes affecting enrollment patterns, key to institutional success. The previous report is about price; this one is about volume. The longitudinal analysis that undergirds this report will lay the groundwork for future forecasting and trend analysis, with a customer-centric focus on student spending and enrollment patterns.
Major themes
Higher ed saw a peak in undergrad enrollments in 2011 with subsequent declines, as is well known. This headline number combines two patterns:
Continued increases in enrollment in the prime college age group below 25 both on a cohort % and absolute level
Older learners act countercyclically and tend to enroll during times of economic weakness
Private non-profit colleges completed a successful decade defending their market share
… While community colleges experienced declines in attendance
Bigger is better… large 10,000+ student colleges lead sector in attendance gains and also enjoy pricing power
Data suggest smaller colleges are being rejected as a category by the market
Smaller schools in flux with significant number of closings & mergers
Smaller schools making significant enrollment jumps in either full- or part-time enrollment during the decade are the exception
Selective institutions experience enrollment growth
The admissions arms race by both colleges and students has escalated
If trends from the Great Recession hold, the current COVID recession will lead to increased enrollment (and lower prices)
Enrollment trends
Overall undergraduate enrollment peaked in 2010 and ‘11 and subsequently declined to 16.3 million in 2018
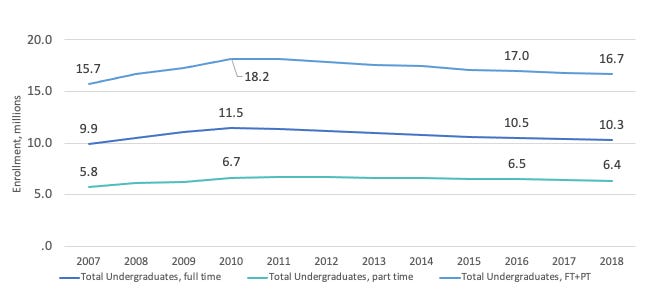
Undergraduate enrollment, total, full- and part-time

Overall enrollment declines -6% across decade
4-year colleges + 7%, 2-year colleges - 23%
Charts includes both full-time (FT) and part-time (PT) students. This report does not use the Full-time equivalent students metric (FTE) for enrollment measurement for clarity’s sake. The prior report on pricing trends did rely on the FTE metric.
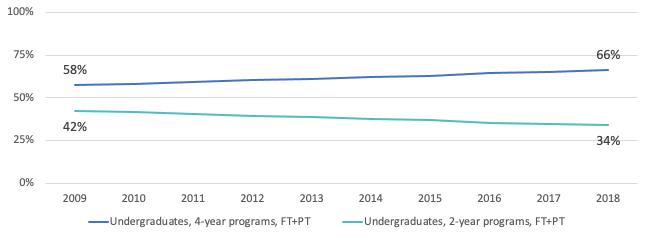
Enrollment decline is felt entirely by 2-year colleges with 4-year ones growing enrollments

Undergraduate enrollment, total students with split between 2- and 4-year colleges 4-year programs seize market share from 2-year ones

Undergraduate total enrollment % market share of 2- and 4-year colleges Private college attendance shows a decline, but this masks strength in the Private Not-for-profit sector, which has completed a decade successfully increasing its market share

Total undergraduate enrollment in public and private colleges At the same time, the For-profit sector has mostly exited the undergraduate business

Undergraduate enrollment in non-profit and for-profit private colleges This reduction is large enough that its is unlikely to be reversed by some recent enrollment growth at For-profit national online colleges (Grand Canyon, Western Governors, Southern New Hampshire)
The enrollment reduction is mirrored in closing of institutions

Number of private colleges ~1,300 for profit higher ed institutions open in 2013 down to ~800 in 2017


The big get bigger, others shrink
Institutional stability among larger colleges continues
As with cost, large colleges have done best in maintaining enrollment levels
Of ~210 schools with >10,000 full-time undergrads, 188 of them held this status at both the beginning and end of the decade
Average full-time enrollment at colleges with over 10,000 full-time undergrads has increased from under 17,000 in 2007 to over 19,000 in 2018, despite the overall decline in college enrollments

Full- and part-time students show different preferences
Mid-size colleges with enrollments between 1,000 and 10,000 students showed enrollment decline of 16% among full-time students in the decade
But part-time attendance holds steady
The charts below show total US enrollment by institution size and the growth experienced by bigger colleges.

Undergraduate enrollment by college size, full-time students only 
Undergraduate enrollment by college size, part-time students only Full-time students classified by size of institution measured in full-time enrollment; part-time students by institution measured by part-time enrollment.
Data shows:
Full-time students prefer large schools
Part-time students don’t seem to have a strong preference…
Both categories are turning away from small institutions


Smaller colleges experience troubles
Instability among smaller colleges contrasts with stability of larger ones
Private schools dominate this category of small colleges and close at high rates
Half of smaller private schools open in 2010 had ceased stand-alone operations within 10 years
Of ~2,000 institutions in this private small school category operating in 2010, ~1,000 remain by 2019
Closure rates for 4- and 2-year programs were similar
Surprisingly, 29% of public colleges with <1,000 full-time undergrads had merged or been closed in this time period
About 1,000 new schools in this size range were established in the decade, taking the place of closed/merged schools
Small colleges also lost market share in enrollment terms
Colleges with <1k undergrads currently educate 7% of the undergraduate population (2018-19, v 8% in 2009)
61% of undergrads attend institutions with over 5,000 students
Limited upside for this category - sizable enrollment gains among small colleges are the exception
Only 72 schools (out of 2,400) in this category in 2009 managed to expand upwards to over 1,000 by decade’s end
The one big gainer was Colorado Technical University, a for-profit which has expanded into a 14k+ enrollment college
Almost all of the other 71 showed marginal gains into the 1-2k range
Significant growth in part-time enrollment is also rare but there are more schools showing large gains (e.g. Long Island University, the Eastern Gateway Community College network in Ohio)
The smaller college category is here defined as those enrolling fewer than 1,000 full-time undergrads. Comments on part-time enrollment apply to a slightly broader set of colleges.
Student age groupings behave differently
Headline enrollment numbers mask different trends in prime (<25 age) and older (>25 age) groups
US college’s overall enrollment decline from 2012 peak to 2019 entirely attributable to older learners (over age 25)
Enrollment students >25 years old has fallen from 6.3 million in 2011 to 4.5 million in 2018
Prime (< age 25) population has shown steady increases in enrollment
Record enrollment of 12.1 million in this <25 age group was just achieved in 2017/18
Long-term trend shows gradual increase in younger cohort enrollment participation rates with no decline seen in the stats
The Admissions Race intensifies
The application process changed dramatically in the 2010s, with applicants to selective schools applying to many more schools
Because enrollments fall only slightly and admissions rates are largely unchanged, applicants to selective schools received an increasing number of acceptances
The average enrollee in a selective college went from being accepted by 2.2 colleges (2008) to 3.9 (2018)
And new students greatly expanded the number of schools where they applied: 3.9 in 2008 to 7.1 in 2018
At 2018 rates, this change in applications added $151 in costs to college searches


Among numerous impacts from this intensified application process, in the financial area more acceptances increases the student negotiating leverage significantly with respect to how much they pay for college
Potential registration in open admissions schools further increases the number of alternatives to students, of course
Yield fell across the industry with only the Ivy League/Stanford/UofC group bucking the trend
Large schools did better than the overall decline in yields, with only a slight decline
That percentage includes about a million students who enrolled in open admissions colleges. With this group removed and leaving only admissions to selective colleges, the enrollment yields had fallen to 25% by 2018.
As a natural byproduct of soaring applications, more students attend selective institutions


Stable flow of students into higher ed
Future demographic declines aren’t apparent in Federal data
Prime age 18-23 cohort will be slightly larger in 2031 than it is now (24.2 million)
Same is true for the more expansive 18-25 cohort
Some cohort size declines thereafter in the 2030s but to put this in context the prime 18-23 age cohort will be all of 3% smaller in 2036 vs 2020
NCES projections to 2026 show increased undergrad enrollment driven by college attendance rates
The 2020s should see stable applicant pools by population segment size
Growth in Hispanic/Latino (0.8M in 2012 entrants to 1.1M in 2026)
White, African-American and Asian populations stable
Concluding thoughts
Higher ed has successfully marketed itself to high school and prime age college enrollees reaping the benefits of increased enrollment and participation within this age group (<25 years old)
2020s cohort sizes provide the consumer base for continued industry success
Gargantuanism, currently often noted in many US industries, is increasingly apparent in higher ed
Smaller schools face dim business prospects. Fulfilling their mission will likely require hardheaded decision-making… and mergers
The US college application process seems to be in the middle of negative feedback loop, creating unhappiness for both buyers and sellers. What can break this loop?