Allusions to looming demographic issues provoking a crisis in higher ed are common. Some representative statements:
“This looming enrollment cliff is being talked about among presidents’ cabinets and boards of trustees across the nation, as higher ed leaders look to get in front of this challenge.” - Higher Ed HR magazine
“Between 2025 and 2029, the college-age population in the United States is expected to decrease by 15%.” - The CPA Journal
“Colleges and universities had been bracing for a much-feared “demographic cliff”—a steep drop-off in potential first-time full-time freshmen projected to arrive in 2025-2026.” - EAB
This issue is a myth.
Raw data from the CDC National Center for Vital Statistics show very stable cohort sizes for prime age college populations up through 2036. The prime age 18-23 cohort numbered 23.7 million in 2018; in 2036, it will number 23.5 million. There is no cliff. Most businesses would be grateful for such stability in their customer base.
The picture is similar for the slightly broader 18-25 cohort.
In fact, these tallies show a bump in both of these prime age population groupings in the mid 2020s.
While it is true that the birth rate fell from 4.3 million a year in 2007 to 4.0 million in 2010, it stabilized at that lower level through 2016, with births similar to years before 2007. For example, 4.0 million babies were born in 2002. In fact, 2007’s 4.3 million represented an all-time high for the US, narrowly edging out the previous recordholder, the 1957 birth year, so 2010’s 4.0 million birth number represents a decline from a peak. Using an atypical beginning date in deriving a story from a data series is a well-worn way to misunderstand a situation.
Higher ed is very focussed on enrolling slightly older Americans who may have missed out on or dropped out of college earlier in their lives. The core of this group, the cohort aged 25-32, will in fact increase in numbers between 2024 and 2036. More opportunity!
Moreover, the 2010s saw increased college participation rates in the prime age group, a result of colleges’ successfully marketing themselves as an essential part of the road to successful adulthood. In 2007, 32% of Americans aged 18-25 were enrolled in an undergraduate program; that figure was up to 38% in 2018. More and more young people see college as an integral step in entering adulthood.
This represents an enrollment increase of 1.7 million students net, which is about equal to the projected decline in this cohort’s total size from 2026 to 2033. One can argue that the participation rate cannot increase forever, true enough, but the 2010s saw colleges enjoy sustained increases easily large enough to counteract any marginal population declines.
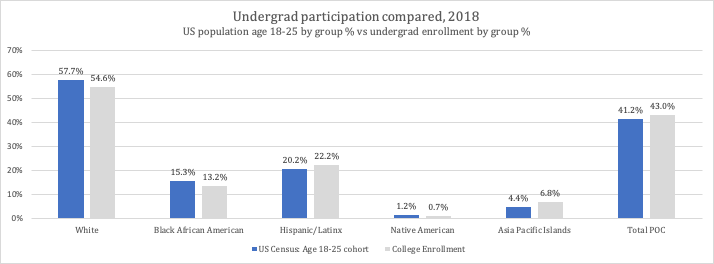
Finally, changes in our population's ethnic composition are sometimes cited as a depressor of college enrollment, But they actually favor higher ed. Both groups expanding most rapidly within the US — the Hispanic/Latinx and Asian-American populations — have higher-than-average college participation rates.
Hispanic/Latinx: in 2012, Hispanic/Latinx students represented only 17.6% of undergrad enrollments but 18.4% of the age 18-25 cohort overall in the US, for a deficit of 0.8% and lower enrollment proportional to the younger population. By 2018, Hispanic/Latinx students were represented more frequently in college (22.2%) than in the age 18-25 population (20.2%), for a net of +2.0%.
(The undergraduate numbers above include Hispanic/Latinx undergraduates of all age groups, which is a flaw, but one that likely depresses this group’s potential to attend college. The 17.6% includes a proportional reallocation of the NCES' significant ‘Other’ category into other ethnic segments, necessitated by the fact that NCES’ Other reporting is much larger than the comparable bucket in the US Census, likely representing a reporting issue. This ‘Other’ category is outsized in California, Nevada, Alaska and New Mexico. The proportions presented below include this reallocation to avoid erroneous comparisons of incompatible data sets. Because three of these four states have above-average Hispanic/Latinx populations, this reallocation may in fact undercount that group’s undergraduate representation.)
The same idea applies on a smaller scale to Asian-Americans. In 2012, the Asian/American population age 18-25 represented 4.2% of the age 18-25 cohort and 6.1% of undergrad enrollments for a +1.9% participation difference. By 2018, Asian Americans increased their comparative participation, in undergrad (6.8%) than in the general population (4.4%) for a net of +2.4%.
Nathan Grawe has presented a more data-intensive and sophisticated argument for a demographic cliff in his 2018 book, Demographics and the Demand for Higher Education. We will address Grawe's arguments in more detail at a later time.
In the meantime, bear in mind that the CDC data is crystal clear: we can expect modest declines in the prime age population. Shifts in ethnic composition don't argue against greater participation in higher ed, they in fact support the optimistic scenario. Finally, a secular trend of increasing proportions of prime age Americans enrolling in undergrad is easily great enough to compensate for a minor -3% change in the age 18-23 cohort size from 2018 to 2036.
Higher ed can look forward to a stable base of potential students.
Please visit the CTAS website for more on the business of higher ed.


