Regulatory changes often trail in the wake of marketplace developments. While 2019’s DOJ/NACAC consent decree eliminating policy restrictions on poaching students during the summer looks on the surface to be a big change in admissions and its calendar, swelling wait lists were creating a summer market for students even before the consent decree.
In our prior post, we had talked about “summer melt”, “summer poaching” and how colleges are working harder on rounding out their classes during the summer. This is obviously important to lightly selective schools, some of them struggling to hit their enrollment quotas. But increases in the size of wait-lists are also occurring at more selective schools and in certain cases provide an important source of students well after the traditional spring response deadlines. Wait list data is selectively released, preventing any nationwide evaluation, so instead we’ll focus on a few selected colleges in the northeast to see what we can learn about how practices are evolving.
Filling out Wellesley’s 2019 entering class
Wellesley College in Massachusetts is the epitome of a blue-blooded liberal arts school. Established in 1870 and boasting a star-studded lineup of alumni and faculty, its metrics reflect a commercially-successful institution with the declining admit rates seen among its peers and a steady yield hovering just under 50%. Yet Wellesley’s wait list size has exploded in the last decade:
This rise is of course not matched by any comparable enlargement of the entering class:
While Wellesley’s wait list has soared from 1,000 to over 3,000, the number of students actually enrolled off the wait list has never even reached 100. In the 2020 COVID cycle, its wait list was 43 times the number of students actually invited off it to matriculate. 43x! Why do this?
Let’s put ourselves in the shoes of Wellesley’s admissions office. Though Wellesley has a nice-sized endowment providing a secure and comfortable existence, the admissions office surely strives to avoid undershooting its enrollment quotas and causing a budget shortfall. The heaviest use of the wait list came in 2019, when 99 applicants were invited off it. That 99 is significant in an entering class of about 600 and, without it, ~$6 million in revenue would have been foregone. Moreover, the Dean of Admissions had just arrived at the job that year and her Wellesley career might have been cut short with a miss of that size. So the wait list is partly about risk management.
Because Wellesley is exceptionally transparent about its admissions data, we tried to reconstruct what occurred in 2019 using some simplifying assumptions. Even at a very selective and successful institution like Wellesley, assembling the entering class required a lot of work after the May 1 deadline and most likely led to a busy summer for the admissions office. Let’s trace the events:
Wellesley receives a record breaking 6,395 applicants and, in the initial cut, accepts 20% of them (1,279). By May 1, the admissions office knows the yield on those 20% lies below last year’s and looks a bit weak at 40%, a shortfall of about 100 students.
Fortunately, it has wait listed almost a third (!) of applicants. Over 1,200 of them have accepted the wait list invite.
Now, almost all of those 1,200 are very good students and have deposited elsewhere with the intention to enroll. Wellesley presumably spends several weeks identifying which of those 1,200 is open to changing their mind and coming to Wellesley instead. In the end, 99 are admitted (8% of those accepting the wait list invite). Wellesley is able to welcome a full first-year class of 612, filling its physical and instructional capacity, much like a Boeing 747 takes off from an airport with all seats filled.
The initial admit rate before the wait list action was 20%, rising to 22% in the end. The yield increases from 40% to 44% by September.
Getting into Wellesley is pretty hard but only 48% of applicants were actually rejected outright. The majority of applicants in 2019 were either accepted in the initial rounds or wait-listed.
Since that 2019 admissions cycle – a bit of white-knuckler for the admissions office – the college’s wait list has mushroomed to over 3,000 applicants, fully 5 times the size of the entire entering class. This displays quite a level of risk aversion on the part of a very successful college.
What are wait lists like for an institution with less elevated levels of selectivity?
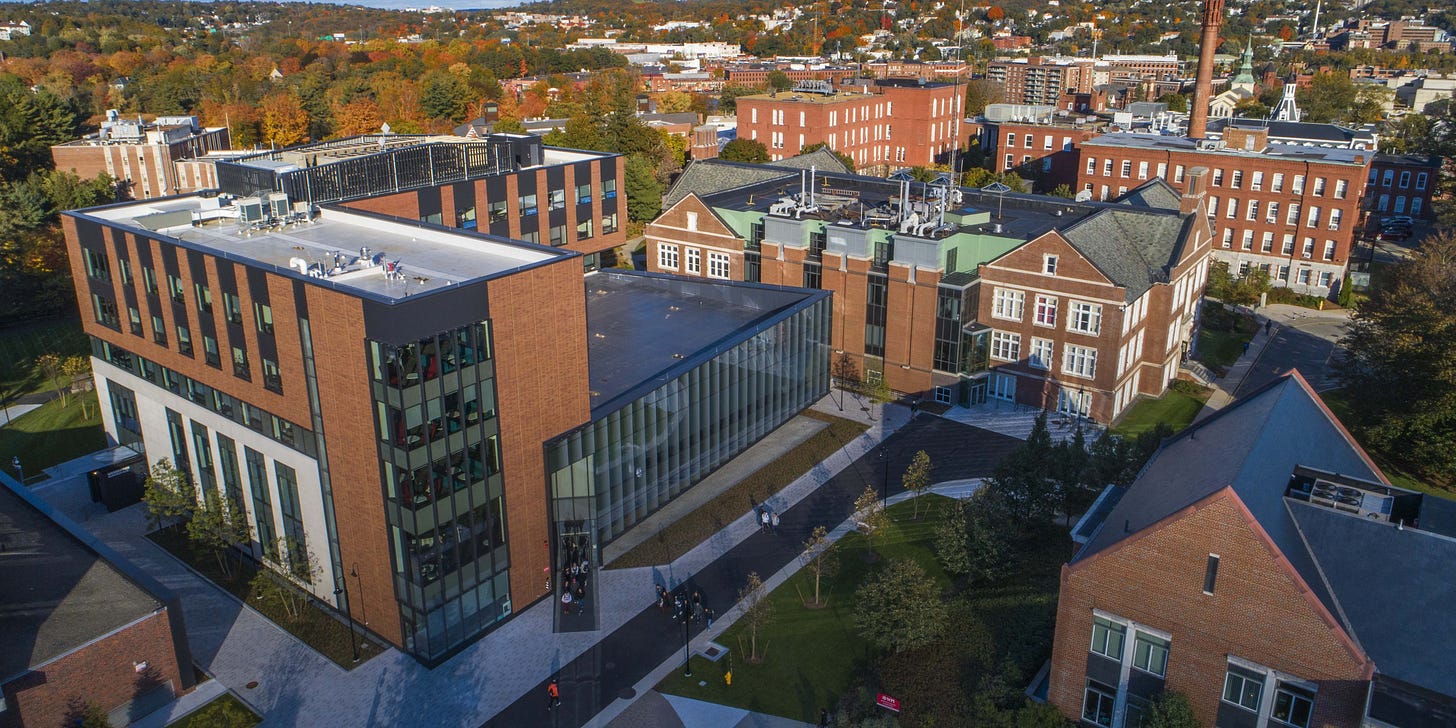
Worcester Polytechnic
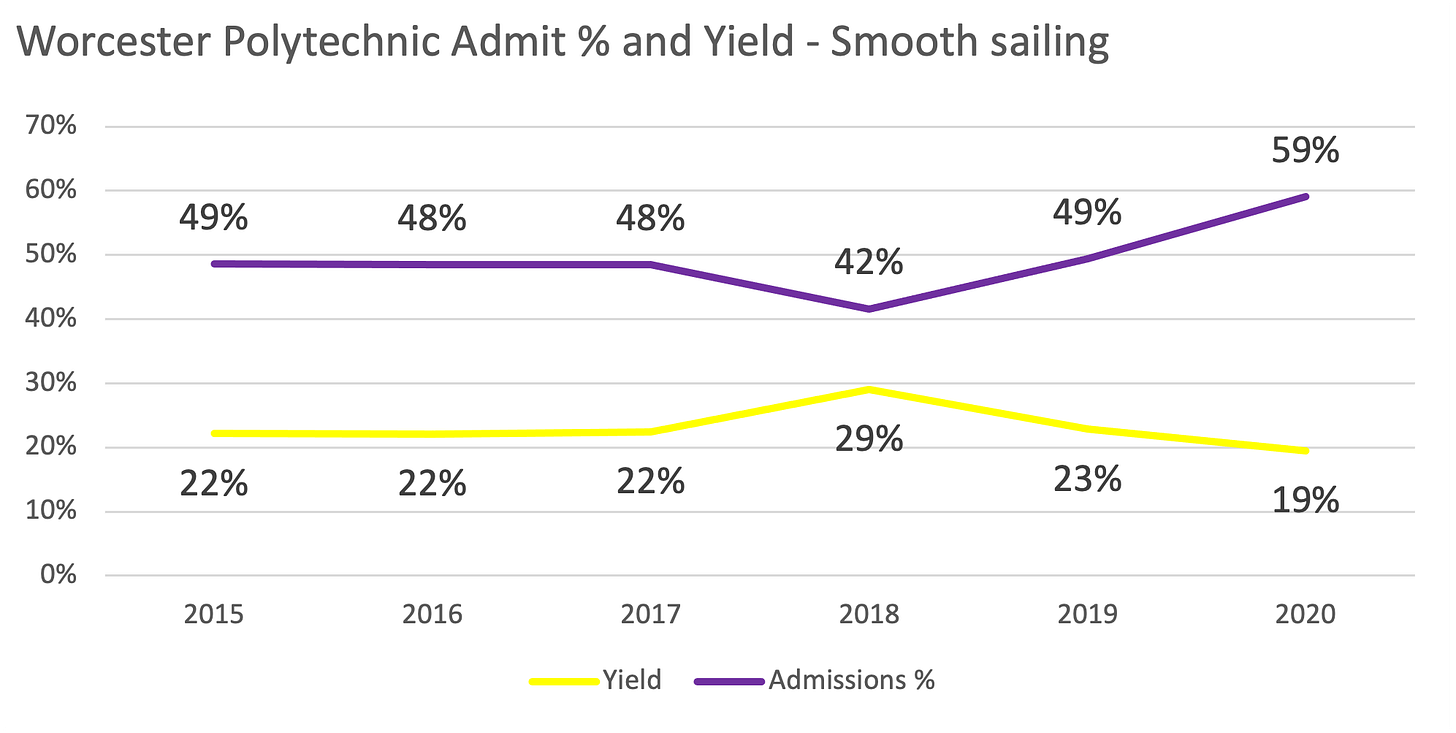
Located in Massachusetts not far from Wellesley, Worcester Polytechnic is a stable institution that does display some of the same stresses as private colleges throughout the US. Welcoming ~1200 new undergrads to its campus each year, it admits in the range of 45% of applicants and has been struggling with yield, which has declined in the direction of 20%. It’s doing OK – its metrics don’t show signs of urgent enrollment symptoms like some of its northeast peers. In fact, the institute welcomed its biggest entering class size in 2020, in the midst of COVID. Nonetheless, it doesn’t have the brand or selectivity of Wellesley. Nor has Worcester shown the long-term trend of increasing wait list sizes:
The proportion of students accepting the wait list invite in a given year is all over the place: one year, just 34% of them accepted; in another, it was 62%. Quite a difference. That low 34% acceptance rate occurred in 2018, the year Worcester put a record number of applicants into its wait list. Worcester’s admissions office may have drawn from the 2018 experience the lesson that inflating its wait list would have no impact on its ability to attract students and consequently refrained from following the pattern of wait-list inflation seen at Wellesley.
This volatility also is present in the number of students accepted off the list. In several cycles, zero students have been admitted, a sign of Worcester’s success. But in 2019, the same year we just reviewed for Wellesley, Worcester shared a white-knuckle admissions season with its neighbor and had to invite 489 students off the wait list, a full 41% of its entering class. This level of volatility is large enough to threaten the entire program. If the wait list had failed to generate students, the class size would have fallen several hundred students short, bringing a significant budget miss, staff layoffs and, maybe most seriously, the public perception of a weakened institution with a faltering future.
If you look at the admit and yield rates, however, Worcester’s 2019 looks similar to what had occurred in the past. Metrics are mildly unfavorable compared to 2018 but in line with previous years.
The surface placidity masked an absolute emergency on the enrollment front. In fact, it looks like there was a management shakeup there that summer in the wake of this turmoil. So overall admit and yield rates can conceal troubles beneath the surface. From the school’s perspective, history shows its use of wait lists to be completely rational.
2019 was an exciting year wasn’t it? - Boston University
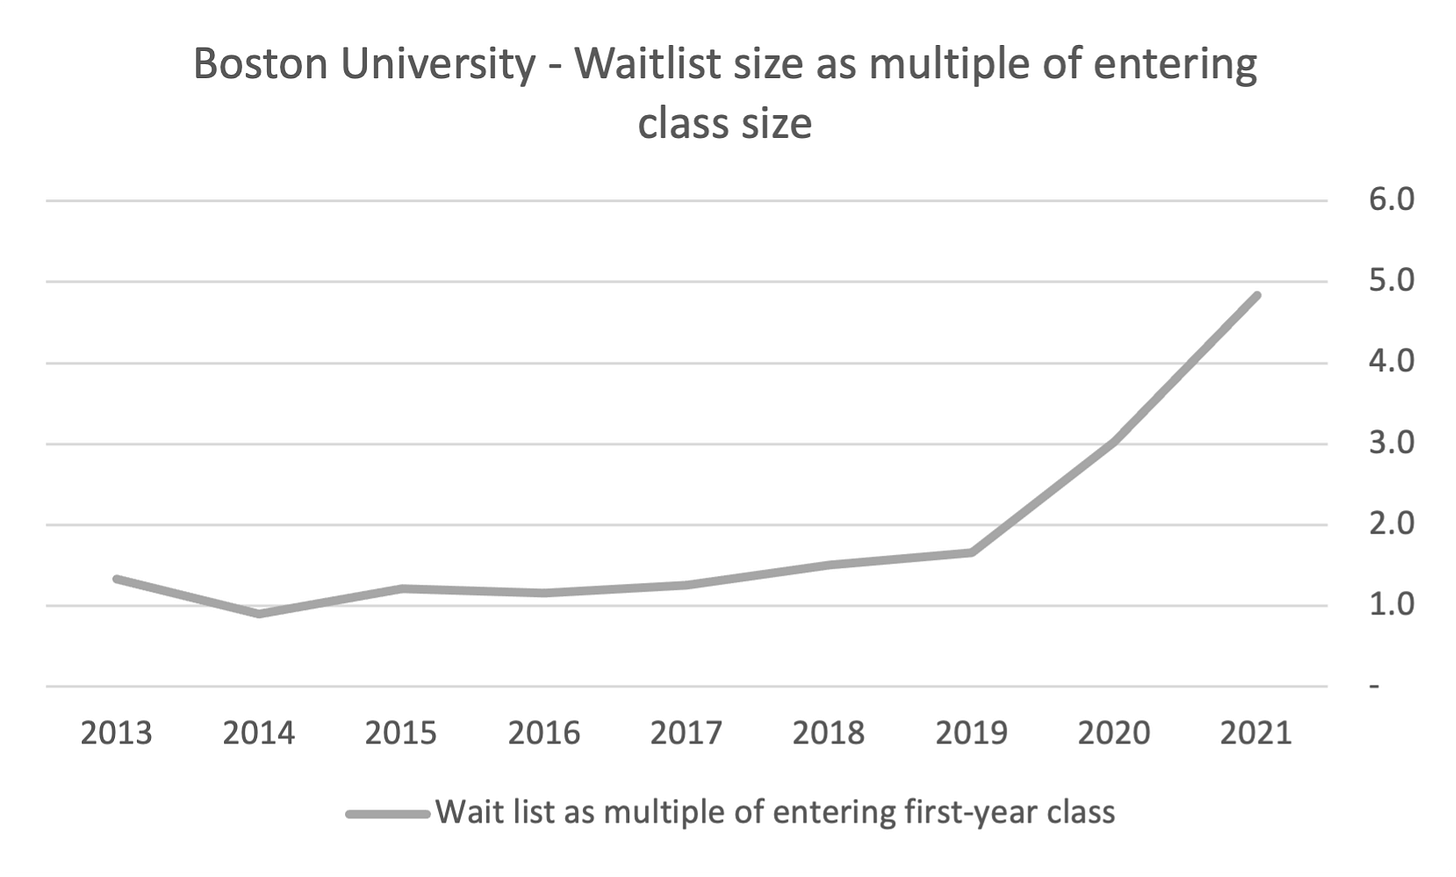
Boston University (BU) is different from Wellesley and Worcester in many ways, but one thing it shared with them was a stressful 2019 cycle. In the five years from 2014 through 2018, BU admitted a grand total of 14 (not a typo) students off its wait list into the entering class. In 2019, it admitted 339.
Up until that year, BU’s wait lists were restrained. Wait lists about two or three times the size of the entering class were typical for Worcester and Wellesley; BU’s were proportionally smaller.
The reaction of the admissions office to 2019 is striking. Abandoning its conservative use of wait lists, it placed almost 15,000 students on it in 2021, three times more than just two years prior. Unlike Worcester and Wellesley, BU’s new approach seems to have been at least partly motivated by the enrollment dislocations of COVID.
Aside from COVID, BU appears to have experienced some issues managing yield and entering class size in recent years. This informative article points to recent entering classes in the 3,500-3,600 being larger than the administration felt could be handled by the physical plant. In 2019, the enrollment target was accordingly reduced to 3,100, bringing with it a tighter admit rate. Prior yield levels held steady instead of rising, maybe to the admissions office’s surprise and, with fewer applicants admitted, the university fell ~300 students short of its target at the end of the Regular Decision round. For the first time in years, BU was forced to invite a sizable chunk of applicants off the wait list.
2020’s COVID cycle brought more uncertainty, with the yield on the Early and Regular Decision rounds plunging from 25% the year prior to 19%, a large decline. Fortunately for BU, it had aggressively wait listed and was able to pull close to a quarter of its entering class off the list. Despite leaning on the wait list, it looks like the university missed its enrollment target that year, down a couple of hundred students in number from the adjacent entering classes. BU going test optional in 2021 provoked more flux. The article linked above reveals that the yield on students without board scores surged to 32% and a single lonely student out of the nearly 15,000 wait listed was admitted.
Variations in yield from 19% to 32% one year to the next for parts of an entering class are of course exceptional and must have provoked consternation in the administration. It’s hard to manage a large undergraduate program like BU’s with such variability. We will need to wait and see how this shaped their approach in the current 2022 cycle but BU’s decision to increase its wait list size was based on rational concerns in a tumultuous recruitment landscape. And, unlike with Worcester and Wellesley, the wait list super-sizing can in part be directly linked to COVID.
Public university patterns
So far, we’ve looked at private colleges only. Is this wait list pattern reflected in public university practice? Broadly, yes. The University of Virginia is one example - despite boasting excellent yields in the vicinity of 40%, it has gradually upped its wait list size. The timing of the increases suggests that it perhaps drew lessons from the 2015 and 2016 cycles, when it enrolled roughly 400 students off the wait list, as well as further expanding the practice with COVID.
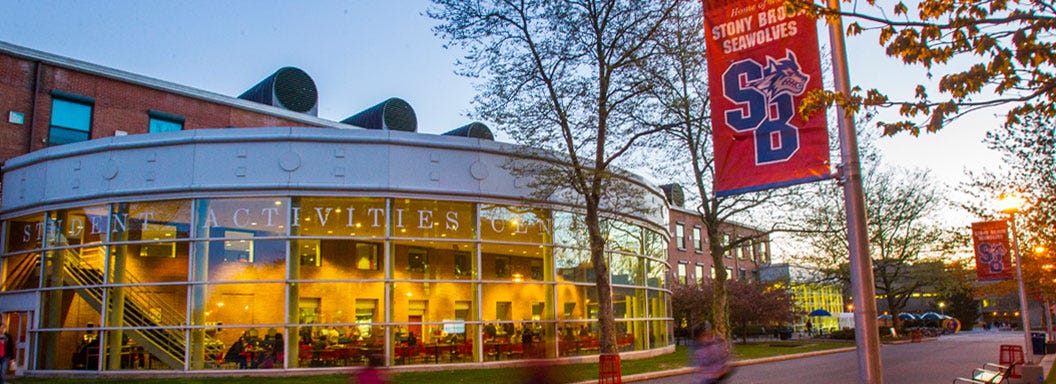
The slightly smaller and less selective Stony Brook University also now wait lists many more students than it did in the recent past.
Stony Brook’s 2020 cycle provides an example of why enrollment offices behave this way.
Of course, students are asked to accept the invitation to join the wait list and many don’t. In 2019, Stony Brook saw 1,492 students accept the wait list invite, a bit weaker than their normal ratio (marked in red in the chart above). The next year, during the 2020 “COVID cycle”, the school both wisely wait listed more applicants in response to the pandemic’s uncertain impact, like many of its peers, and also saw a much better response rate to the wait-list invite. This was fortunate because it proved a hedge against that year’s uncertainty as Stony Brook ended up accepting over 1,400 students from the wait list, 43% of its entering class. If it had wait listed at the 2019 rate, an enrollment shortfall would have been very likely. The heavy reliance on the wait list continued in 2020, when Stony Brook admitted almost 1,200 students off the wait list. The university’s higher levels seem very much justified by pandemic enrollment patterns.
Why?
Enlargened wait lists are justified for institutions with medium levels of selectivity. Both Stony Brook and Worcester Polytechnic have admit rates in the 40% range and yields in the low 20% range. And both were able to manage through at least one recent admissions cycle because a large enough wait list saved the day.
The case for big wait lists at more selective schools like Wellesley and the University of Virginia is a bit less obvious. Wait lists do allow them to tweak the entering class after the Early and Regular Decision rounds. None of the schools discussed in this post rank their lists, giving the admissions offices some flexibility to hit academic, demographic and, yes, financial targets.
Every year Wellesley’s first round of admissions sent out in March slightly undershoots its target. In no year from 2013 to 2020 did Wellesley not invite anyone off the wait list, suggesting that it is a useful device in putting together its entering class and not the result of an unexpectedly low yield or an error.
Wait lists may have an added financial angle for need-blind institutions such as Wellesley. Criteria used to invite students off the list are murky. It would be possible to use student’s financial disclosures to hit the college’s tuition revenue target if any shortfall arises, by inviting full-pay students and those requiring little need aid. This isn’t a question of institutional survival — Wellesley has a big endowment. It’s a matter of hitting budgets and meeting internal expectations. Now colleges without a need-blind policy use enrollment management platforms to hit their budgets. That’s normal practice. So wait lists may have a special utility for the small set of highly-selective need-blind institutions.
Simple caution on the part of admissions office. Higher ed staff are a naturally risk-averse group of people. And enrollment jobs, especially at private colleges, can be dicey and unstable. There’s no cost to wait listing a student, so it’s handy job insurance for enrollment staff, allowing them to reach enrollment and budget targets and maintain their personal reputation.
Thoughts
No data on wait lists is available yet for the 2022 admissions cycle, but their surge can be traced back to before COVID, only to be intensified by the pandemic and its knock-on effects. Because their growth is driven by factors both related to COVID and not, we expect extensive use of wait lists to have continued into the current year.
Even at highly competitive colleges like Wellesley and Boston University, schools have often actually been rejecting only 40-50% of applicants. A great many get shunted off to a wait list.
Managing the expectations of applicants is difficult in this situation. There’s no doubt that, if relying on wait lists helps enrollment offices, it takes a toll on many students. “Will you go to the prom with me?” “Maybe.”
Extrapolating from the five schools covered here leads us to believe that there are well over a hundred thousand applicants each cycle who have deposited at one school while also accepting a wait list invite at another. Especially energetic applicants out there likely have several wait list feelers out there. Wait lists this size create a sort of untracked enrollment market operating over the course of the summer. And it has nothing to do with the NACAC consent decree.
That pool of wait listed applicants is a suction “upwards” in the prestige ladder. The suction pulls students away from lower-ranked schools, some of them financially stressed.
Who financially benefits from the widening use of wait lists is unclear. The wait list is financially advantageous for colleges because it sometimes allows them to pick those needing less aid. But most of these students being picked have college arrangements in place, so they don’t need to accept any old aid award. This dynamic will vary by individual situation.
We will wrap up our series on the current admissions cycle with some broader concluding thoughts in our next installment.
Find more information at the CTAS site. CTAS provides data, reports and personalized assistance with college pricing and aid appeals.


