More Midwest: The Big Public Universities
Our series on retention stops by the upper Midwest’s public universities
In our previous installment covering retention, we looked at the many private colleges scattered across the upper Midwest and found a generally healthy ecosystem with solid retention results. This result contrasted pretty sharply with the weakness very apparent in the adjacent northern part of the Great Plains. While some private colleges in the upper Midwest showed signs of commercial weakness, many others continue to do well, both in terms of enrollment and student outcomes. In today’s installment, we will look at their public competitors in the region, extending our approach of comparing admissions against retention rates. What does such a comparison tell us about the public universities in the upper Midwest?
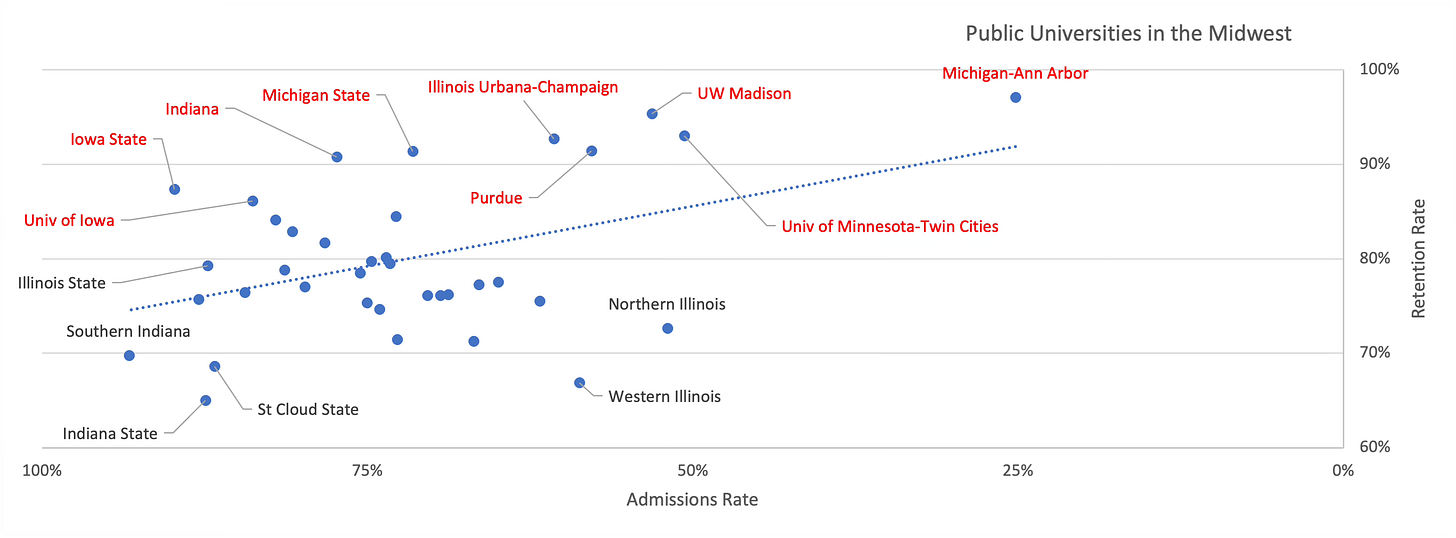
Midwestern flagship state universities have retention falling evenly on a line when plotted against selectivity. That retention level is excellent but it also suggests that the universities are close to indistinguishable in terms of academics and student satisfaction. Differences stem from location and, to an extent, branding.
Smaller, less selective regional public universities in these states – schools like Grand Valley State in Michigan or Northern Iowa – report a lower level of retention across the board. The results are truly bifurcated between the bigger state and the regional universities.
Expanding the comparison to include public universities of the Great Plains and a few other neighboring states makes it clear: the upper Midwest public universities are running high-performing undergrad programs that contrast favorably with those in some neighboring states. There was also one perhaps surprising result which you can read about below. All in all, it’s fair to characterize this as one of the strong parts of the higher ed industry.
How do we know whether a college is running an effective undergraduate program? Retention – the % of first year students returning for a second – offers an up-to-date metric. While it isn’t the be-all-and-end-all - other measures and information remain important in “grading a program” - retention offers a bottom-line result measuring whether students can do the course work, can afford to pay for the program and, finally, like what they are getting from the college. While 4- and 6-year graduation rates are another good metric, the reports are published with a major lag. Retention appears more quickly. Because retention at different classes of institutions isn’t comparable, this series of posts tries to decompose what retention is telling us about schools in a given category and region to allow for valid comparisons and to draw some lessons.
No bad news here
The big flagships in this part of the country show high levels of student satisfaction and success. The remarkable thing here is that, with the exception of the University of Iowa, all report superior retention results above 90%. (And Iowa’s 86% retention for the 2016-19 academic years is pretty good, especially given its very light selectivity.)
No bad news here. And no surprises either. In terms of retention performance the universities are about equivalent. Michigan measures as an elite public, as you’d expect. The most “disappointing” result, from Purdue, is strong, at a 91% rate. In fact, Purdue and its state rival, Indiana, post statistically almost identical retention results despite how Purdue is much more selective.
One result that may surprise is that the University of Minnesota occupies the same tier as the main Madison campus for Wisconsin, despite Madison’s higher general reputation. Even if Minnesota is a bit weaker than UW Madison, its positive results really stick out in terms of qualitative perception and reputation, suggesting UMN is underrated. The fly in the ointment is that Minnesota’s selectivity was slipping in the pre-COVID period examined here, while Wisconsin was become more selective.
At the low end of the selectivity spectrum, Iowa State, the easiest intros group to get into, reports a notably strong retention of 87%. Because of its recruiting difficulties, Iowa State is very aggressive with its financial aid offers to non-residents and also admits most applicants. But any recruiting difficulties are not preventing it from producing very strong academic and student satisfaction results, making the school an exceptional value given its low cost.
One question this data provokes is whether the schools are really very different from each other. Michigan provides superior academic and satisfaction results than, say, Michigan State, in an absolute sense. But if you accept that admissions and retention are positively correlated – the evidence is overwhelming – it’s not at all clear that there are meaningful academic differences between the rival campuses. This observation extends to the public flagships in the chart below. There is some variation around the regression line, but it’s minor compared to other regions we’ve analyzed. Readers understandably could see this chart and conclude all the institutions are the same except for some perception of prestige on the public’s part.


Regional universities live in a different world
The flagships and big “State Us” – with their consistently excellent results – operate in a different world from their nearby regional public universities. The large public universities are in red here, to highlight how they uniformly sit at a plateau above the regional schools.
Even the best regional programs don’t have the same student results as the lowest retention figures for the larger programs:
The four regionals that stand out here, with retention results above 80%, are:
Grand Valley State (Allendale, MI)
Northern Iowa (Cedar Falls, IA)
U Wisconsin – Eau Claire
U Wisconsin – La Crosse
What do these four colleges have in common? Higher entering SAT scores. In 2018, these 4 universities had among the top 5 SAT scores for the group as measured by 25th percentile. (The 5th such school, the University in Minnesota – Duluth, is close as measured by retention but not quite on their level.)
We also highlighted 5 schools with very poor results when compared to their selectivity:
Southern Indiana (in Evansville)
Indiana State (in Terre Haute)
Saint Cloud State (Minnesota)
Northern Illinois (DeKalb)
Western Illinois (Macomb)
What do these schools have in common? All have significant portions of their entering classes reporting SAT scores in the three digits. (Average board scores presented here include ACT tests as conformed to the SAT, so all students submitting test scores are included. Evaluated through 2019 before the COVID test optional wave occurred.)
For the two Indiana schools on this list and for Saint Cloud, these test scores fit their light selectivity, which means that some students with low board scores get in. This drives down the retention results as some of the entering students are underqualified. It makes sense.
What doesn’t make sense are the results from the two Illinois regional schools. Both Northern and Western Illinois report admissions rates in line with much lower retention. This causes the regression line – upward angled in almost every chart in our series (because selectivity is strongly correlated with retention!) – to be downward tilted in this instance. Without the two Illinois schools, it would show its normal upward pattern. Given our recent installment on reporting of admissions stats, we suspect the two Illinois universities have not traditionally reported admissions numbers in line with industry standards.
Beyond the puzzling Illinois data, this part of our study exposes how using retention v admit rates, while often illuminating, needs to be used with caution. The four outperforming schools aren’t the most selective among the regionals but, for whatever reason, they draw on an applicant base with fewer low board scores. Are they running better programs than their competitors with lower retention? That’s an open question. Though the student outcomes are better, it may simply be due to better academic qualifications in the recruitment base.
A complete list of the schools included in the charts above can be found at the end of the post.
Big upper Midwest publics aren’t just better than the regionals in their states
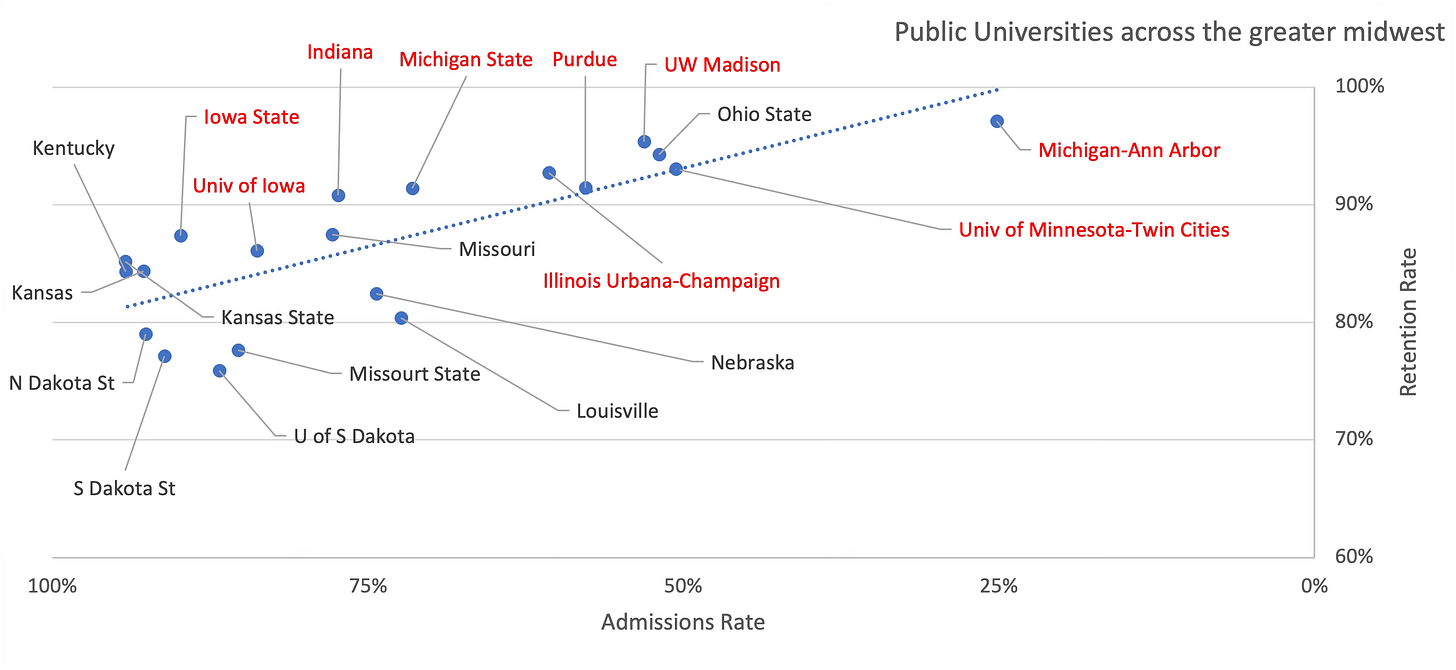
To display just how high performing are the big midwestern public universities, we will compare them to the big state universities in adjacent states, from North Dakota to Kansas to Ohio:
Our big upper Midwest public universities form a different and higher tier compared to colleges like Louisville and Nebraska, though Missouri and Ohio State present two exceptions.
Even the big Midwest flagships which are not more selective than those in neighboring states, like Indiana University and the two Iowa universities, outperform comparable state schools in neighboring states by a fair margin.
The comparison of Nebraska with Michigan State illustrates this superior performance. On the face of it, these schools seem to have many similarities. Michigan State is better endowed on a per student basis, but not shockingly so; its incoming students have a somewhat better conformed SAT score (there was a 42 point difference in 2018 for the 25th percentile of each income class, meaningful but not enormous); and it is a bit more selective. But the schools are still roughly comparable. When it comes to retention, Michigan State has been reporting retention results above 90%, very strong results when compared to its selectivity, vs Nebraska’s consistently reporting results in the 81-83% range. (English translation: a fifth of incoming Nebraska first years disappear by the next fall.) Further confounding factors can no doubt be isolated to explain parts of this difference, but it sure seems like Michigan State takes in slightly better students and generates much better performance. Qualitatively, we can report strong interest in Michigan State on the part of many midwestern students -- this interest is completely justified by the reported metrics. It may be overshadowed by Ann Arbor, but East Lansing is a big high-performing public institution. And each class it graduates is equal in size to the entire Harvard undergrad program. Kudos for its social impact.
Madison – matched by others?
One observation jumping out from the charts are the similarities between Wisconsin-Madison, Ohio State and the University of Minnesota’s main campus in the Twin Cities. This was a surprise because -- let’s be honest -- Wisconsin-Madison has a higher prestige factor than the two other schools. Setting a few statistics for this trio side by side doesn’t so much downgrade the view of Madison as it elevates the two others:
UW Madison’s entering students are a bit better qualified. The results: its students experience a bit more success than Ohio State and Minnesota students. Our capsule summary here is that the three programs are run equally well – and very well on an absolute level – but that there is no meaningful difference in retention and student satisfaction here.
The proximity of the Ohio State test scores to UW Madison also came as a something of a surprise. What do the 75th percentile entering class scores look like?
This illustrates how good the stronger students at these big flagships are. Ohio State is certainly a reputable university, but the fact that 25% of its student body has SAT-equivalent scores above 1470 is nonetheless unexpected. These three flagships are very similar – and in a good way.
Concluding thoughts
The highlight here is the geographical and sector-wide outperformance by the big upper Midwest flagship universities. Even where we attempt to impose more controls, schools such as Michigan, Minnesota- Twin Cities, Michigan State, Illinois and Indiana look to be running excellent academic programs. And they are delivering significant social impact as they serve a couple of hundred thousand students. That size, scope and quality must have a big and positive social impact.
The relative outperformance by Iowa State in Ames when compared to the University of Iowa flagship in Iowa City is noteworthy. Iowa also starts with a slight test score advantage vis-à-vis Iowa State. Things are stacked for the flagship but Iowa State nevertheless delivers better retention. This one goes to the underdog.
The regional public universities in the Midwest operate in the shade of the big schools in every way, but campuses like Grand Valley State in Michigan, the Eau Claire and La Crosse campuses in the U Wisconsin network and Northern Iowa all deliver retention above expectations. While we hardly think its the final word on this question, this outperformance can be attributed to recruiting bases with better academics and hesitate to attribute it to better academic programs.
If the University of Michigan is the class of the field, it does not deliver results that are much better than campuses like Minnesota or Michigan State when tracked against its admissions rates (no hate mail, please). What Michigan does deliver is a top rung of students with absolutely outstanding academic aptitude. Michigan for example graduates more students with SAT scores above 1550 than Princeton does in a given year. (No claims being made here that test scores are the be-all and end-all. This is just a factual observation.) The persistent overemphasis on Ivy Leagues in the press and media stands in stark contrast with the general fact that high quality public universities like Michigan and its peers likely graduate more high academic achievers. The nugget about Princeton and Michigan is a snapshot of this phenomenon.
Let’s elaborate a bit.
Princeton 75th percentile score: 1549 (2018 results). Graduating class of ~1,300 students annually. ~425 Princeton grads each year have a SAT conformed score above 1550.
Michigan 75th percentile score: 1526. Graduates ~6,000 students annually. 1,500 students with scores above 1525.
Using one possible Bell Curve distribution – one that disadvantages Michigan – we estimated that Michigan probably graduates about 800 students each year with scores above 1550. That’s a big pool of high testing students and it is about twice the size of the Princeton cohort.
CTAS supports families and the educational professionals counseling these families with integrated college financial aid, pricing, funding and financial planning advice to help them shape their futures with direction and agency. Advisory Services are offered through Creative Financial Designs, Inc., a Registered Investment Adviser. 2704 S. Goyer Rd., Kokomo, IN 46902. 765-453-9600. Creative Financial Designs, Inc. does not provide tax or legal advice.


Fascinating data, thank you!