The 2023 Admissions Cycle, Part II
A closer look at four selective programs with application declines. Plus a round-up of 2022’s “hot schools."
In Part I of our survey, we’d looked at a few private institutions - Denison, Villanova and University of Miami - that are evolving into highly selective schools while nonetheless observing how the widespread crazy surge in applications during 2021 and 2022 had abated across the general landscape. In Part II, we will focus on cases with significantly fewer applications being reported this year, including two high profile New England institutions which didn’t seem to mind and two others which experienced the effect of new Department of Education guidelines. We will then as a wrap briefly review how some schools that were “hot” in the 2022 cycle fared this last one.
Application declines: the real…
As mentioned in Part 1, quite a few universities have seen marginal drops in application totals. For example, Georgetown and Cornell both saw 4% declines in 2023. But these schools continue to enjoy extensive student interest well above pre-COVID levels, have generous financial resources and are recruiting effectively. Several colleges saw more meaningful declines.
The first of these is MIT, touched on in Part I, where we speculated that this is exactly what their admissions office wanted when it reinstated mandatory standardized, announced in the middle of the 2022 application season and applying to the 2023 year.

If you look at MIT’s applications over a longer term, 2023 was still abnormally active.
MIT’s timeline is worth reviewing quickly. It required testing in the 2020 cycle, despite the disruptions wrought by COVID, and only announced a new test optional policy afterwards, in the summer of 2020. The MIT administration clearly had misgivings about test optionality with Stu Schmill, the Dean of Admissions, writing:
“We regularly research the outcomes of MIT students and our own admissions criteria to ensure we make good decisions for the right reasons, and we consistently find that considering performance on the SAT/ACT, particularly the math section, substantially improves the predictive validity of our decisions with respect to subsequent student success at the Institute.”
The resulting surge appears to have been a headache, with Schmill walking the new policy back less than 24 months later. If our supposition that MIT doesn’t at all mind the 2023 decline is on point, the admissions office would probably like to see an equivalent decline next year and a return to late 2010s levels, when MIT was a highly selective college with a very strong student body and zero enrollment concerns. What it also shows is confidence. MIT has a big endowment and its reputation is really founded on its graduate programs and research. It barely cares about its selectivity and will be highly ranked by US News & World Report whatever the admit rate is.
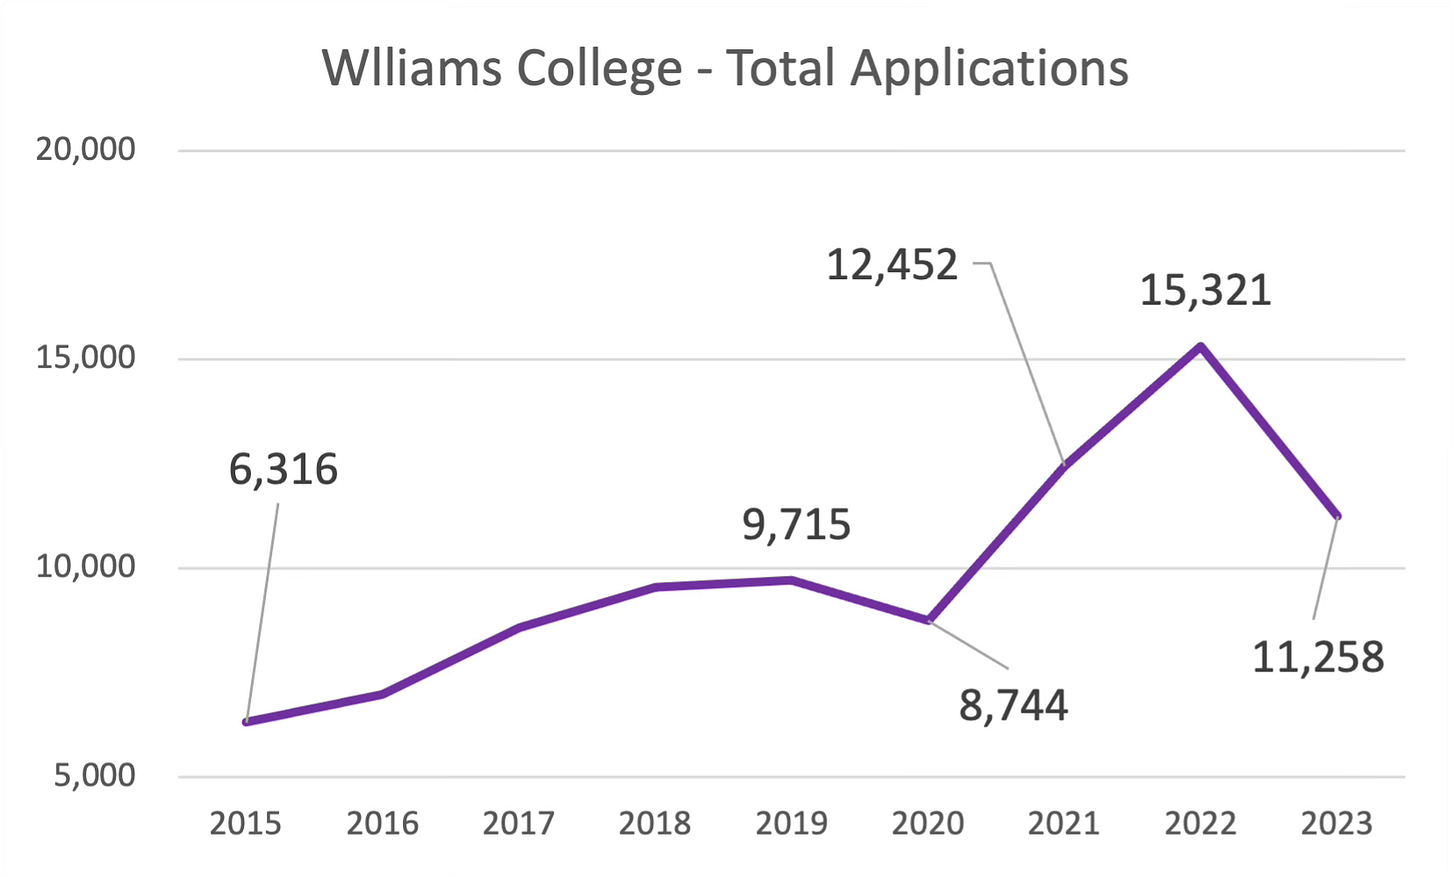
Similar confidence was displayed at another Massachusetts institution, Williams College. This liberal arts school saw a significant drop in 2023 applications, though to a level still above that of a few years ago.
Williams has a vast endowment for a school its size so it’s hardly threatened economically by this. In fact, the admissions office freely admitted what was going on in the campus newspaper write-up. The admissions office began requesting a supplemental essay as a trial in 2023, a requirement which apparently has been reversed for the upcoming 2024/25 cycle. One possibility is that the applications drop was caused by students who were really not interested enough in Williams to write a separate essay but who would have applied if no extra work was needed. Those students who didn’t apply saved themselves some time and a bit of money. While Williams is not as dependent on Early Decision (ED) as some other colleges, the ED round generated close to half the entering class (44% in 2022), effectively making the Regular Decision (RD) round, when the bulk of the applications arrived, hypercompetitive. In 2022, Williams accepted 2% of applicants in its regular decision round and exactly zero off its wait list. So those 4,000 fewer applications means a lot less time wasted and hopes dashed.
The growing importance of the ED round is effectively shutting middle class families out of selective colleges that rely on the round. While Williams has a policy of meeting full need, this is not really very comforting because outsiders have no idea how need is calculated nor what the final bill will be. We’re noting that there is growing awareness among parents and students that ED isn’t really binding, but the social pressures around walking away from an ED offer continue to be strong, in particular at private high schools. That means applying ED is fraught with risk. So where do the sort of middle class children capable of graduating from a school like Williams go? No surprise, to big public universities, where the higher achieving students are arriving with academic statistics similar to those seen at selective private colleges a few years ago. Tracing this change is too big a subject for here, so let’s get back to Williams’ 2023 cycle.
Interestingly, Williams responded to the decline in applications by accepting about 200 fewer students, something a less well-funded institution may not have done. The campus newspaper in fact pointed to the strain on facilities the larger 2022 incoming class had caused in the link above. This well-financed Ivy+ college seems to have reacted with nonchalance.
While Williams and MIT saw real declines in applications, two other schools reported much lower figures and, in an interesting development, it turns out this was driven by a methodology or accounting change.
Application declines: … and the accounting-driven
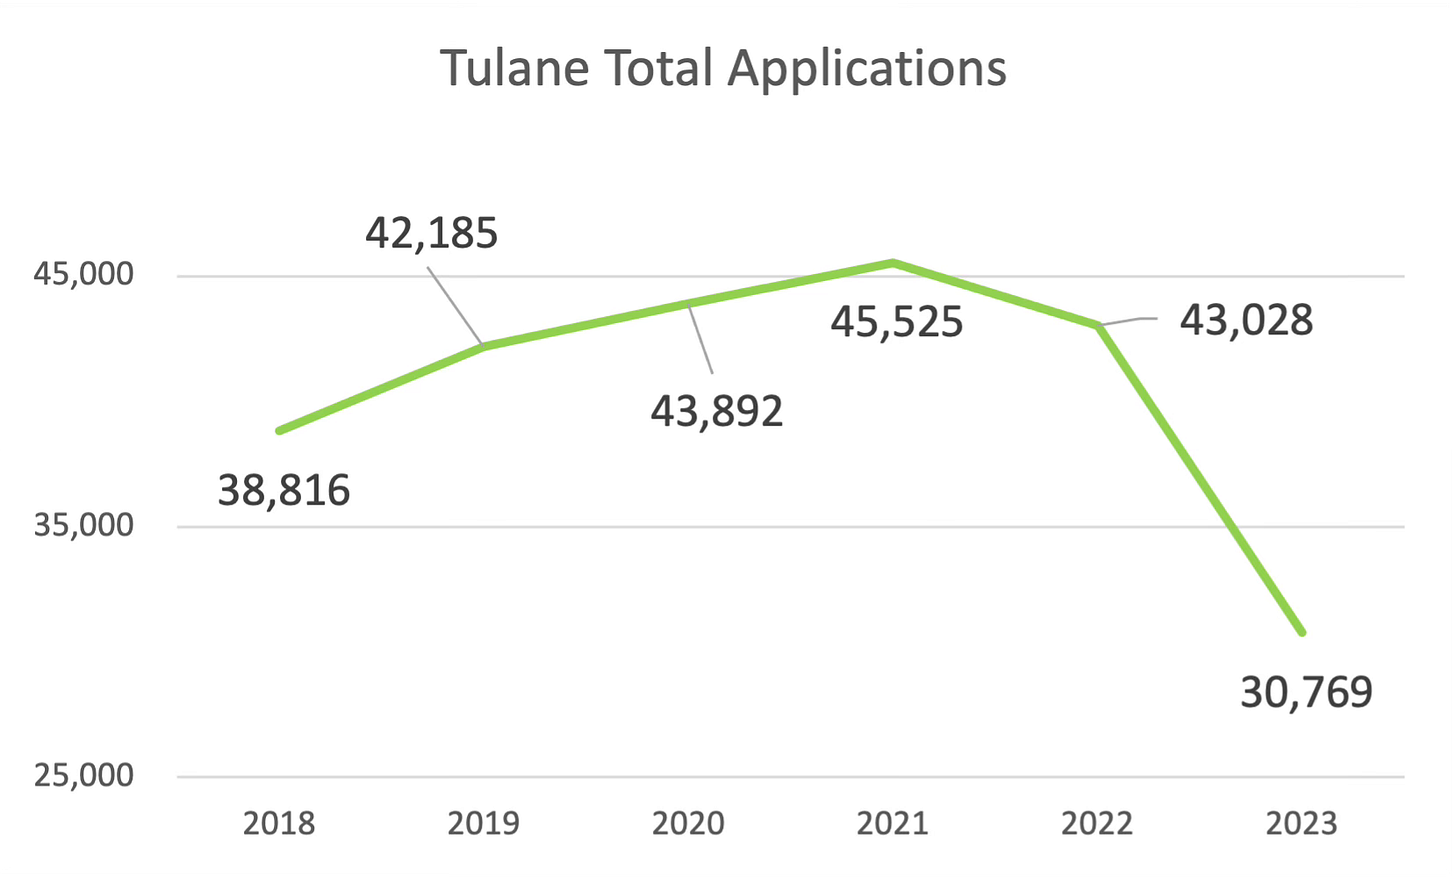
Bad news is often buried — and so it was in press released concerning Tulane’s 2023 application cycle. The routine annual press release from the university’s president makes no mention of applicant totals and the 30,000 cited here is not set next to prior results. Curiously, this latter press release also makes an admission against interest by acknowledging the total includes 2,000 incomplete applications.
Higher ed data isn’t audited and its metrics are often poorly defined, so there’s a real concern that application and admit figures are gamed, with one specific worry being application totals potentially inflated with barges of incomplete applications. Interestingly, the Department of Education issued a clarifying ruling in its 2023/24 FAQ, instructing colleges not to count incomplete packages in their application totals (if that prevented action on the application). In the chart above, the numbers from 2021 and before are from IPEDS and 2022 and 2023 come from Tulane press releases. But if we go to the school’s 2022 Common Data Set (CDS), the number of applications reported is 31,615, not the 43,028 from the press release. The sequence of events here is unclear but it appears that the Dept. of Education’s guidance on applications reporting was issued before the 2022 CDS was reported but after the press release boasting about the 2022 entering class. It also means that the IPEDS data, showing more than 40k applications in recent years, included incomplete applications. By our calculations, if you used the 2022 press releases, that generated an acceptance rate of 8%, but if you used the newly-defined completed applications, the number is 11%. That is really not a huge change and shouldn’t affect anyone’s view of Tulane. But the comparison suggests that there were over 11,000 applications that students began but never completed, a quarter of the publicized total. That’s a lot of incomplete applications. Tulane is a CommonApp participant and hasn’t charged an application fee since 2008. Likely, those 11,000 students asked for their applications to be sent to Tulane and then didn’t follow up. The Dept of Education guidance led to Tulane revising its accounting. It’s all a bit mystifying. But the concern about application totals and admissions rates being gamed by certain programs appears to have been justified.
Tulane has seen higher applications accompanied by a disproportionately steep increase in selectivity. If they accepted so many fewer students, how did they fill their seats? A simultaneous increase in yield tied to the increased emphasis which Tulane, like Williams and so many others, has placed on its Early Decision round: Tulane admitted 1,258 students from its ED pool in 2022 out of 1,843 entering first years. The Early Decision applicants were both accepted at a 68% rate in 2022 and made up 68% of the entering class. Meanwhile, the Regular Decision acceptance rate for that year was 8%. Another factlet to emerge from the university’s 2022 CDS is how it invited 6,232 students on to its wait list and ended up admitting all of 3. (Our advice to students is to make a decision on whether or not to accept any wait list invites before the applications are submitted - for your own mental health.)
So there’s an evolving tangle in Tulane’s recent enrollment history. Possibly fictional increases in applications plus higher yields and stricter admissions made the program look good. Meanwhile, reliance on ED supports higher-paying students who are less sensitive to cost while burnishing the yield and in turn admissions rates. All with the legal yet questionable inclusion of maybe 10,000 non-applications in the applications stats reported to the government.
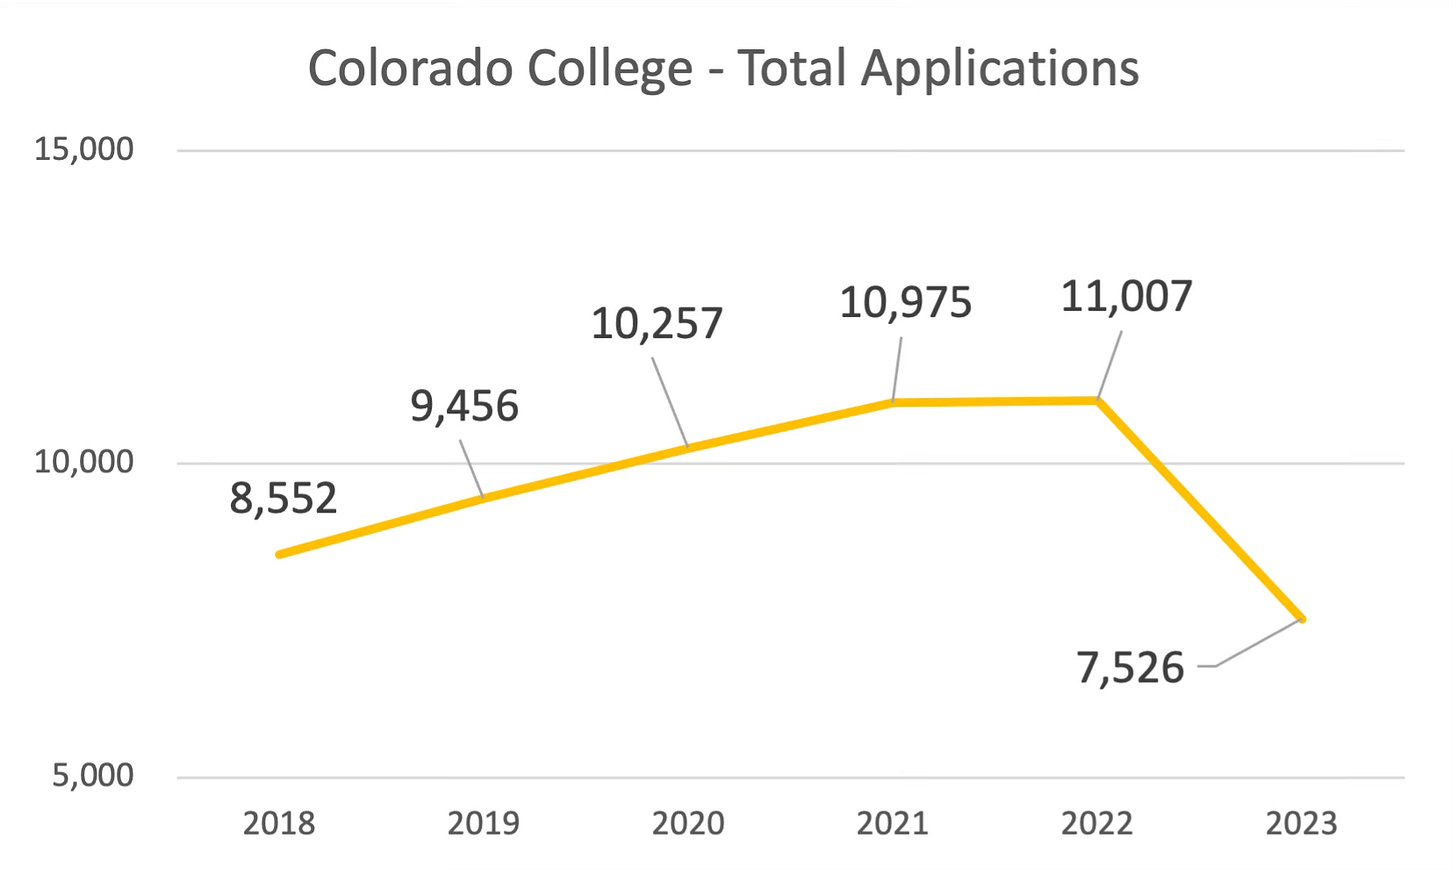
Tulane was not the only institution to display this pattern. Colorado College in Colorado Springs reported exploding applications in the COVID period. But the decline in 2023 reversed all those gains and more, returning to a level lower than in 2015.
With this drop, the admissions rate came close to doubling, from an all-time low of 11% in 2022 to 20% this cycle. And in the middle of this cycle, Colorado College withdrew from the US News Rankings with an adversarial public letter. What’s happening here?
The chain of events seems similar to Tulane. The 2022 figure in the chart above comes from a press release. But if you looked up the school’s Common Data Set for the 2022 admissions cycle, you’d be puzzled to see an entirely different number: 7,846. The CDS also reveals that there were a total of 11,027 applications total, if you include incomplete ones, a number very close to the press release number cited in the chart above. What about the 10,975 reported in 2021? That is again not from a press release but from IPEDS and matches exactly Colorado’s CDS data. Like Tulane, Colorado College has for years apparently been reporting incomplete applications in its application totals, decreasing its admit rate artificially. And this inflation of applications is significant. 28% of Tulane’s reported application totals were incomplete, 29% at Colorado. Colorado, like Tulane, doesn’t charge an application fee and uses the ComonApp, among other application workflow tools. Colorado’s acceptance rate for 2022 wasn’t 12% as initially reported, but 16%. Colorado initially reported an 11% acceptance rate that year but that looks to have been increased slightly to 12% with the finalized data, another example of applying positive spin when possible.
So the applications decline for Colorado College isn’t real. It’s pure accounting; the change likely motivated by the IPEDS FAQ clarifying what counts as an application. It also means that the college isn’t as selective as once thought. As a check, we looked at the 2022 CDS for Denison and Villanova and its information matches the press releases, so we should infer that neither ever counted incomplete applications. (Because we know someone will ask, we also went ahead and checked Harvard’s and it appears they haven’t been counting incomplete applications, either.)
Let’s make an analogy, to a neighborhood, a ritzy one given that these four colleges live there. There’s the solidly well-off who have no problem dropping the fact that their business saw much lower revenues last year, secure enough not to conceal this fact. Then there are those who are “Keeping up with the Joneses”, who hide the fact that they are earning less money, make a point of showing off their possessions and actively conceal that they’re not quite as wealthy as they pretend. It illustrates the pressures felt by admissions offices at even successful private institutions like Tulane and Colorado. Meeting and beating metrics is very important to these schools.
NYU and Northeastern
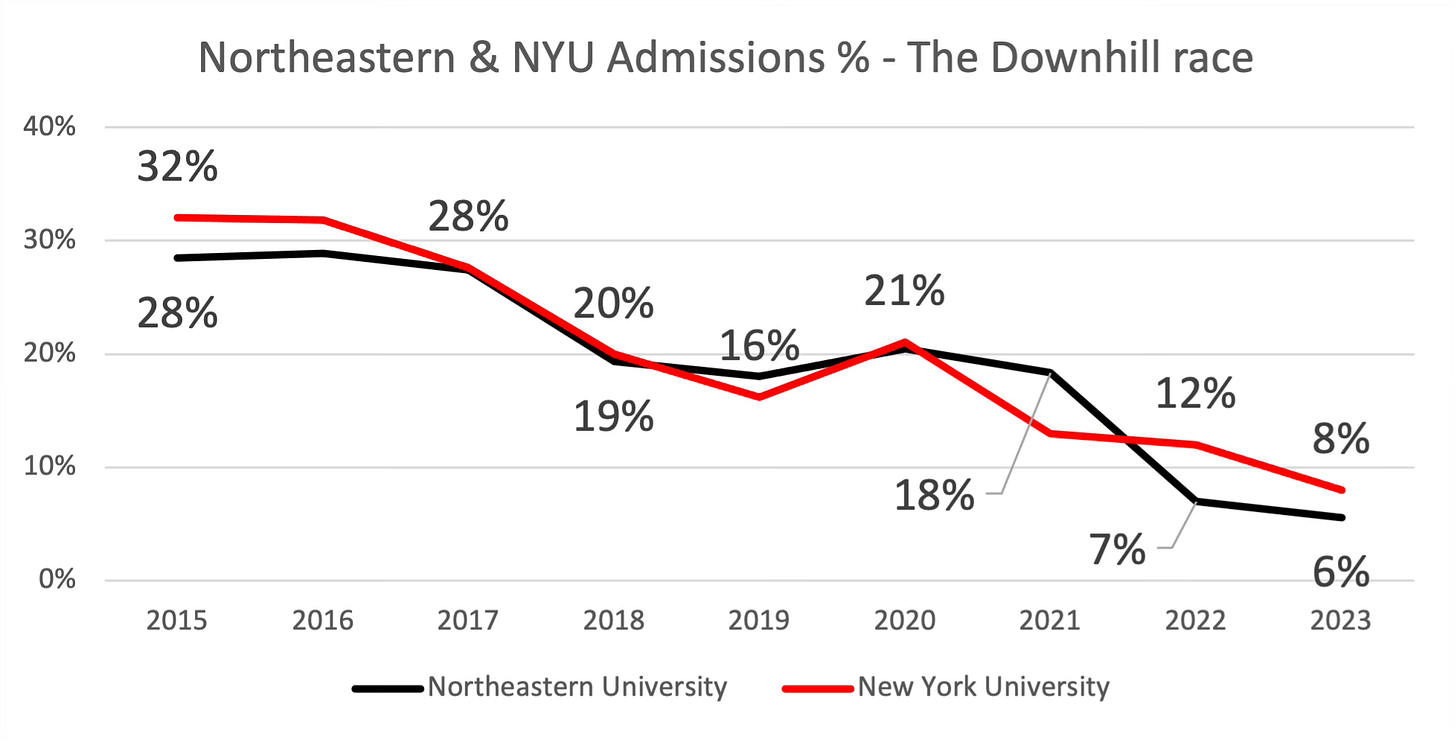
What would a survey of an admissions cycle be without covering New York University and Northeastern? Rest assured – both saw record applicant levels and increasing selectivity. (We know you were worried for them.)
After seeing its admissions rate plunge from 18% in 2021 to 7% the next year, Northeastern proved it wasn’t a fluke with a 6% print this cycle. And NYU, which we estimated produced the highest revenue of any undergraduate program in the US a while back, penetrated into the single figures for the first time, admitting 8% of its 120,000 applications.
The increasing selectivity of NYU and Northeastern was not matched by two of the institutions which we’d highlighted as doing particularly well in our overview of the 2022 cycle, Colgate and Florida State — but both didn’t give back their gains, either. Colgate held steady at a 12% admissions rate and Florida State increased by 1% to 24%. This consolidation shows that the two schools’ popularity, which we argued was solidly supported by their retention statistics and qualitative comments from current students, is continuing.
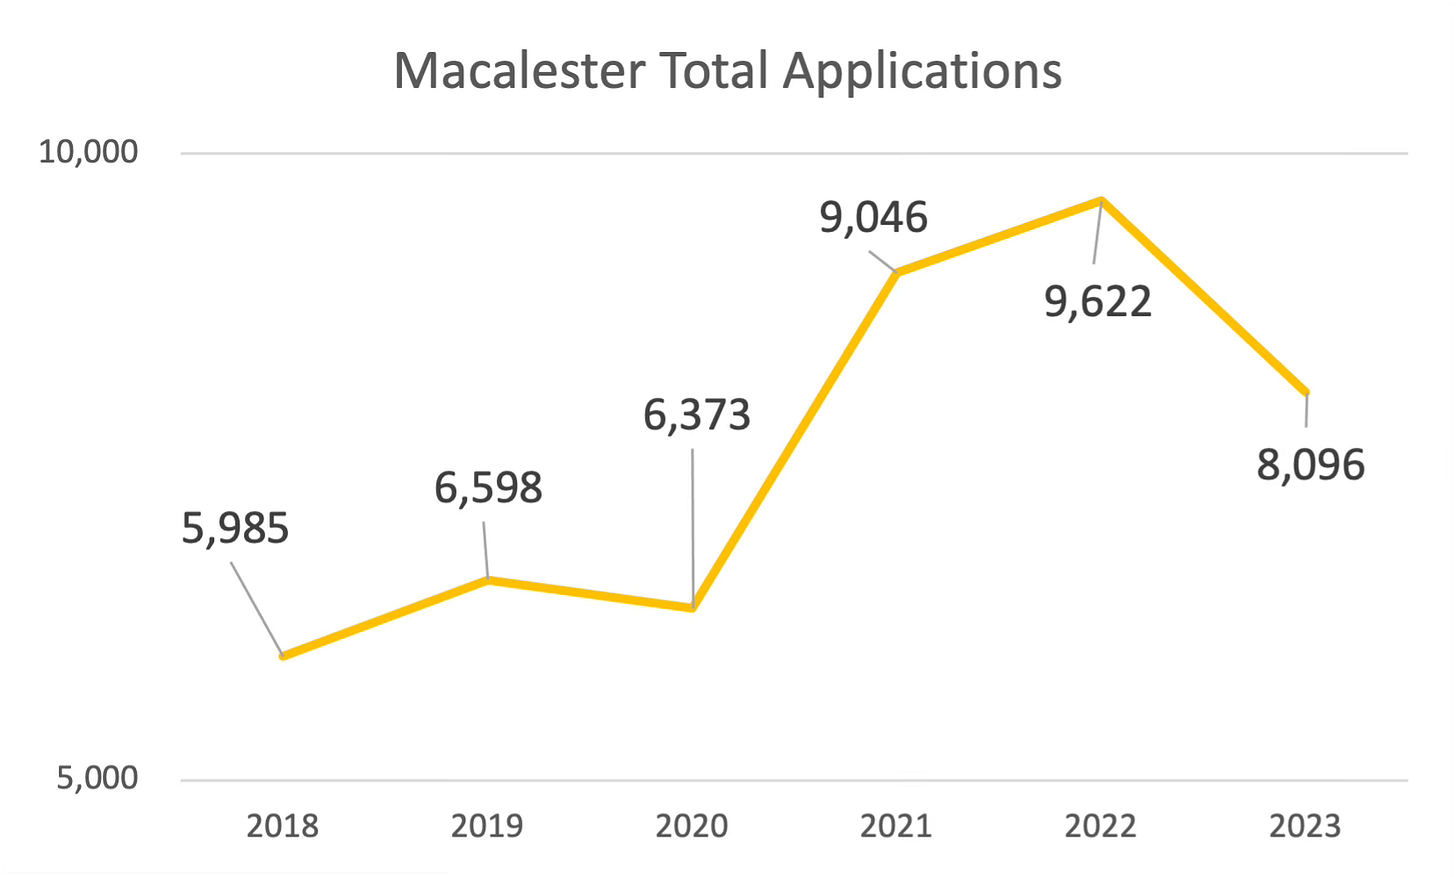
This cannot be said of the 4th school featured in the overview of 2022, Macalester College in Minnesota. Macalester saw a fairly steep 16% decline in applications, which is unlikely to have been caused by a Dept. of Education-driven accounting change.
The level continues to be higher than before COVID but the drop is real.
Concluding Thoughts
The good news in all of this is that the Dept. of Education’s clarification on counting applications will make data from 2023 and after more reliable. Inclusion of incomplete applications shows the pressure enrollment offices are under to make numbers, pressure which will likely pop up in another part of the balloon. One possibility could be a new, creative way to work the wait lists. Some bright admissions officer will think of something.
We highlighted three colleges who have seen meaningful increases in applications, leading to greater selectivity, Denison, Villanova and the University of Miami. None of these institutions have responded by significantly increasing their program student bodies. The difficulties colleges face in expanding is real. We must assume that a school like Villanova looks at the many qualified students interested in attending and wants to accommodate them. The issue is how to do so, given the limitations on real estate in places like Philadelphia and Miami. One answer is merging with ailing institutions, illustrated by Villanova’s takeover of Cabrini University’s physical campus (not its educational program).
The Dept. of Education guidance regarding counting applications led to the discovery that certain institutions were inflating their application totals to appear more selective than they were. In particular, we looked at what Tulane and Colorado College had revealed in its data disclosures. This illustrates the severe pressure to meet and beat the numbers felt by admissions officers in the current climate.
Another highly selective institution, MIT, succeeded in reducing the number of applicants by once again requiring board scores. Not all colleges want high totals of applicants. The juxtaposition of MIT - testing required - and Harvard - test optional - is a nice natural experiment showing how much test optional policies incentivizes students to apply to very selective programs. Harvard saw a 7% decline in 2023, year over year; MIT saw a 21% decline, a difference of almost 5,000 MIT applications. Critics of standardized testing have emphasized diversity, opportunity and freeing students from spending money and time on testing. The downside of test optional is that it seems to waste a lot of time and money spent submitting and evaluating additional applications both on the student and admissions office sides.
Finally, NYU and Northeastern showed continued declines in their admissions rates, with NYU travelling into the single digit admissions rate for the first time. And newly ultra-popular schools like Colgate and Florida State consolidated their post-COVID popularity. The selective schools covered in this post are generally doing just fine, thank you.
CTAS supports families and professionals with integrated college financial aid, pricing, funding and financial planning advice to help them shape their futures with direction and agency.





I love, love, love your data analysis! Thank you so much!