


Super Publics
Certain public universities are enrolling high-achieving students en masse. Part 1 of a 3-part series.
A recent post on midwestern public universities noted that the University of Michigan now enrolls far more students with elevated SAT and ACT scores than a smaller elite university like Princeton. A review of the data up until the 2019 entering class shows that certain public universities – whom we will dub the “Super Publics” - are now educating large numbers of students with the type of credentials needed to matriculate at an Ivy League institution, and that significant portions of their student bodies have very strong academic aptitude. Though some of our readers will no doubt be quite aware of this phenomenon, public perception doesn’t appear to be absorbing this important emerging trend though the data is out there in plain sight.
We will begin by looking at SAT and ACT results for all students to outline the testing environment, then focus on a trio of University of California campuses and follow up with several – to us surprising – developments in the northeast, in particular, in New York and New Jersey, and a look at how some non-flagship regional campuses are thriving. To take one example, did you know that Binghamton University, an underpublicized part of the SUNY complex, has an upper quartile of students that score better than the lowest quartile of students at the Ivy League schools? The data hopefully will foreground some eye-opening things about how these Super Publics, amid ever-increasing selectivity at the high-end private colleges, are successfully enrolling more and more high-achieving students.
This post relies on self-reported data from the colleges through the 2019/20 academic year, the last before widespread adoption of test optional policies during the pandemic, to look at the composition of student enrollment. SAT and ACT scores are both included in the statistics, with the ACT converted into the SAT scale using the official 2018 conformance with a 1600 point maximum. The statistics cover students enrolling at the institution for their first year, not applicants or admittees, and uses the Integrated Postsecondary Education Data System (IPEDS) data buckets for the 25th and 75th percentiles of these incoming classes. All scores use the 2018 conformance, both before and after that date. We also want to very much acknowledge that test scores are not the final arbiter of academic achievement, but they are widely available, scaled uniformly and aggregated to serve as a proxy.
SAT and ACT results
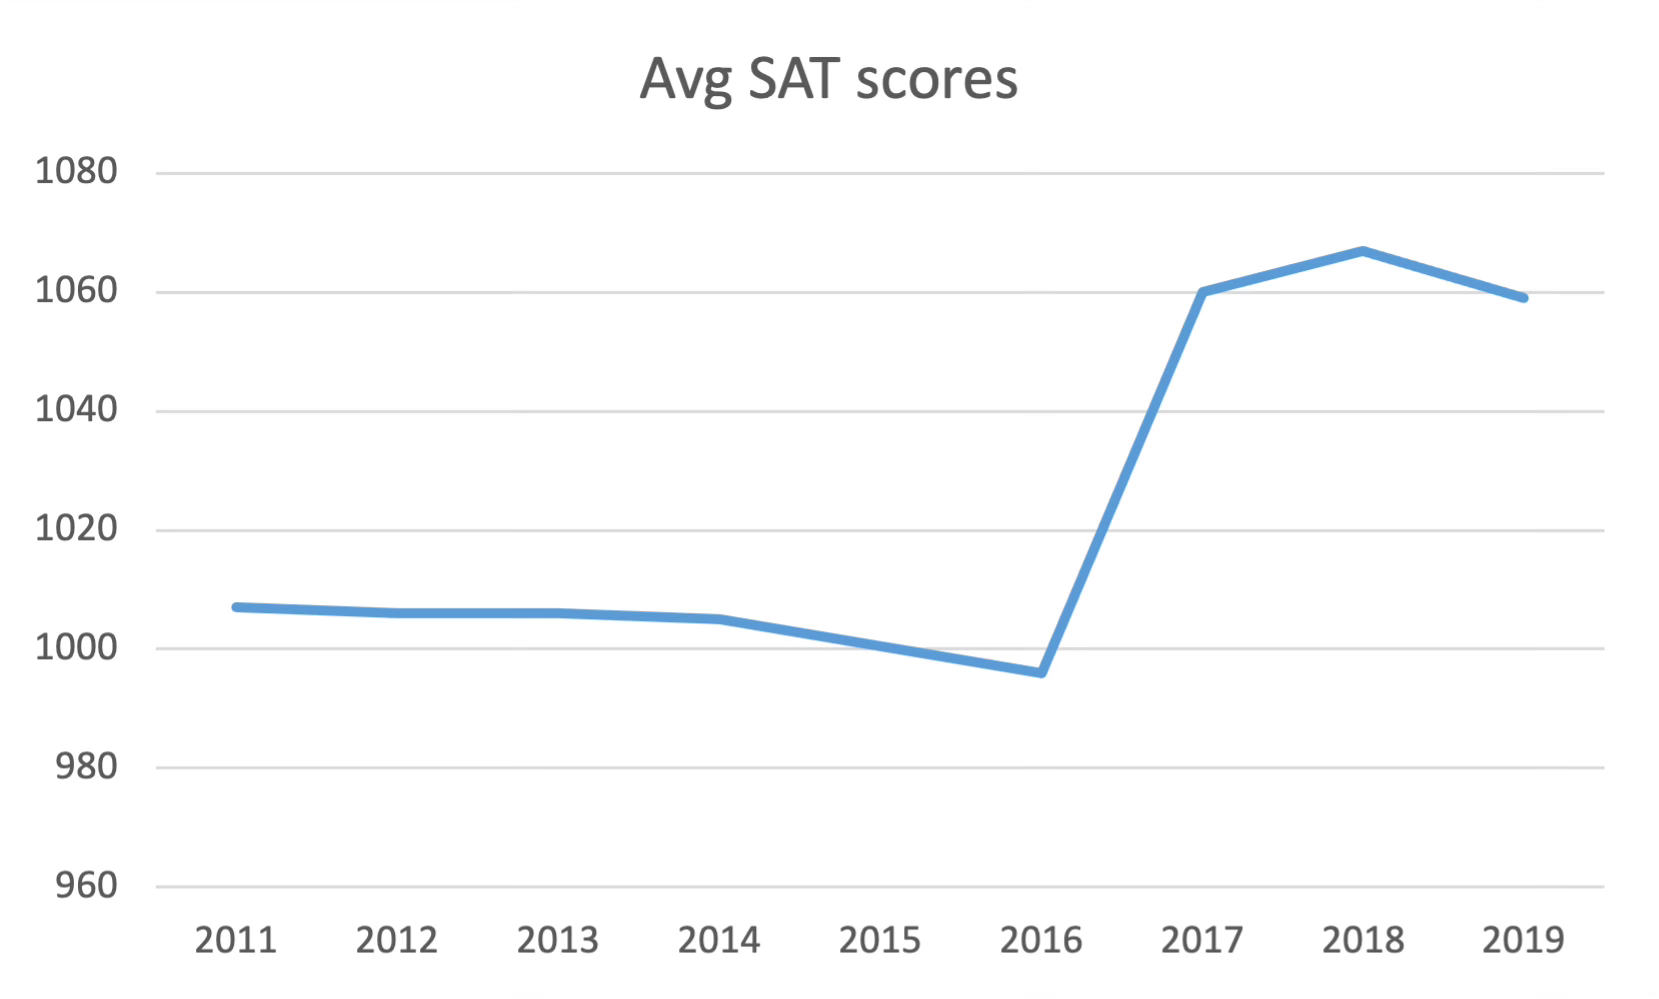
The first question we need to address is whether any individual examples are part of a general upward trend in scores. This has has been a very confusing time for those relying on the College Board’s SAT results, due to the split of language tests in 2006 and then the reversion to a single exam in 2017, something which was accompanied by a renorming of the SAT. In 2017, along with the fusion of the Critical Reading and Writing tests, the average score jumped 64 points from the prior year, to a level almost 60 points higher than the typical average score earlier in the decade:
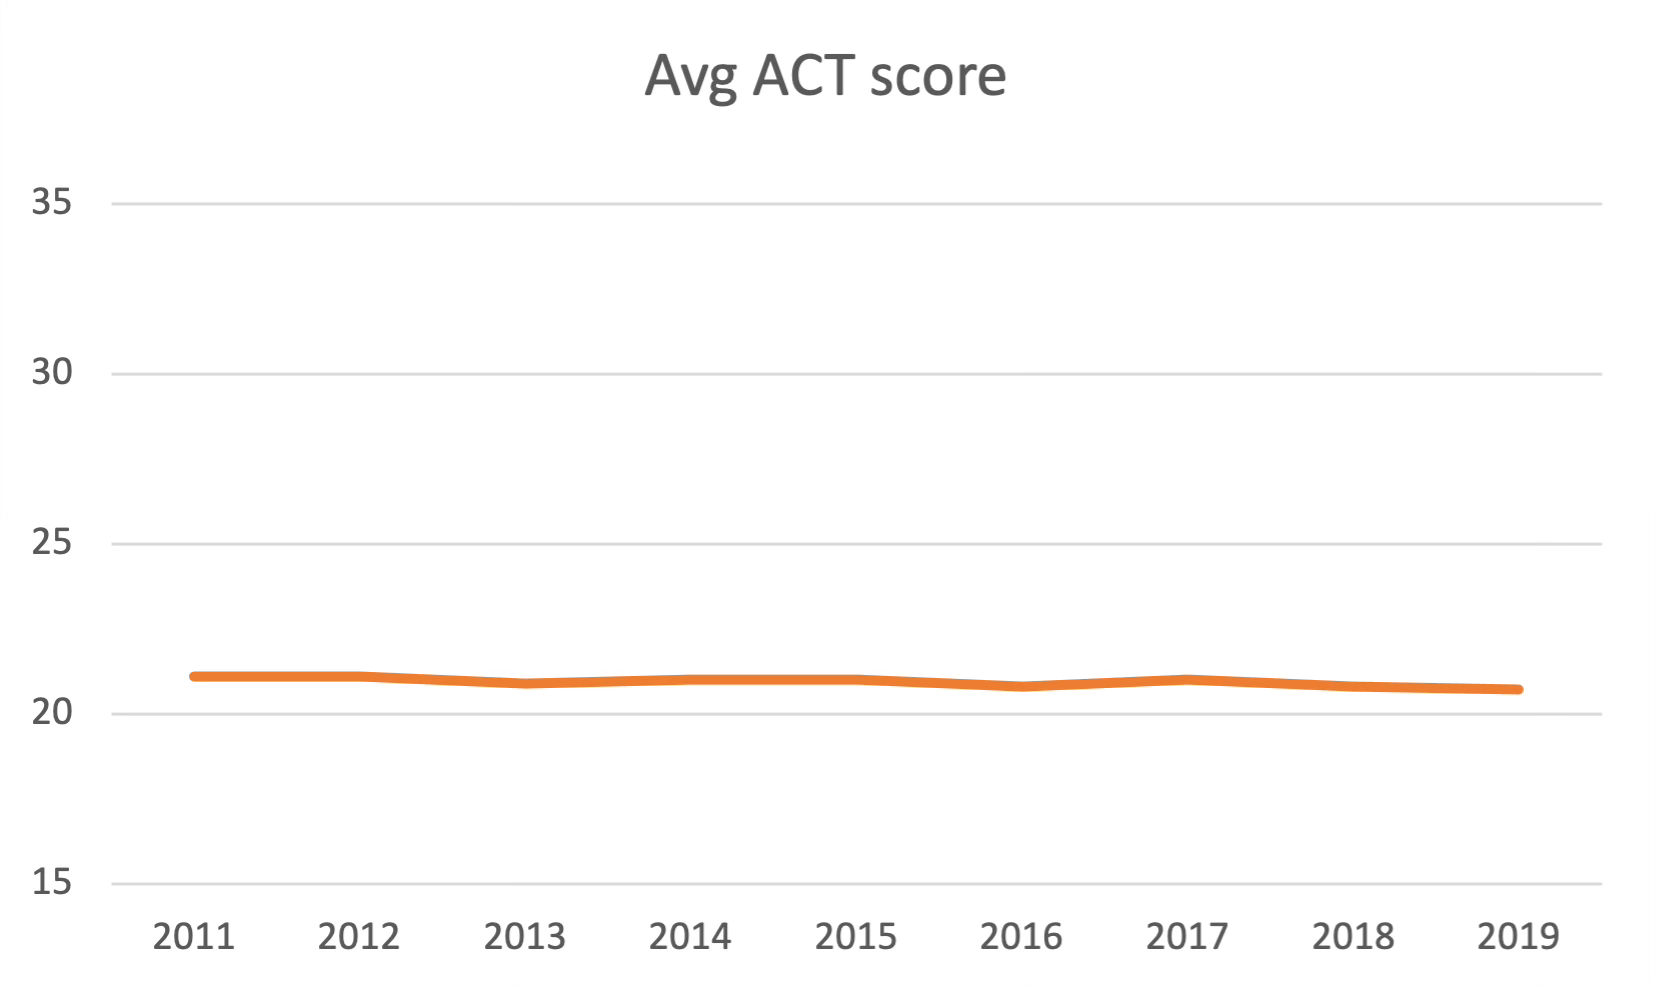
The ACT meanwhile showed none of the SAT’s variability:
The SAT is the slightly more popular of the two tests, with almost 2.2 million students taking it in 2019, compared to about 1.8 million using the ACT. What about the higher testing students, the segment we will be looking at most closely here? The number of students scoring above a 1500 on the SAT surged between 2017 and 2018, not surprising given the renorming. That last linked article also points to an increasing share of ACT takers scoring above 30 between 2008 and 2018, which isn’t the result of a renorming. The percentage of SAT test takers with scores above 700 climbed from the range of 5 to 7% before 2016 (depending on the test, the College Board doesn’t appear to have released combined scores), to 7% in 2017, a level that was reliably reached through 2019. Because of absolute numbers matter here, the rise from 5% to 7% implies roughly 40,000 more SAT test takers scored above a 1400 in 2017 due to the re-norming.
This isn’t the place for an in-depth dive into psychometrics and testmaking, but we need to note that a further complication is the move by certain states like Illinois, Michigan and Colorado to require SAT testing in high school, which increases the population taking the exams. Because there are so many moving parts in this picture, we should keep these changes to the metrics in mind as we focus on individual college programs. To boil it down, the SAT mean scoring changes in 2017/18 contributed to an approximately 30 point increase in overall scores (over a 1600 scale) when combined with ACT results, together with an unquantified but material increase in high scores.
A final complexity is that these scoring changes impact admissions over time, as many high school sophomores and juniors take the exams, not just graduating seniors, many students take both the SAT and the ACT, and many only submit their highest scores to the colleges, to make them look the best. So the IPEDS data we are using is misaligned to the overall student population and distribution of scores. But the rise in high scores overall can’t account for the changes at the individual colleges we will look at. The very informative Compass Education article by Art Sawyer in the link above contains data broken down by state and you will see that increases in absolute numbers of these students are not large enough to account for the sheer number of higher testing students arriving at our “Super Publics”. This strongly implies that a re-sorting is taking place: not only are students producing more high scores but the high scorers are increasingly attending certain schools. That’s a hypothesis, but it’s one that looks sound.
UCs: Santa Cruz, Santa Barbara and Riverside
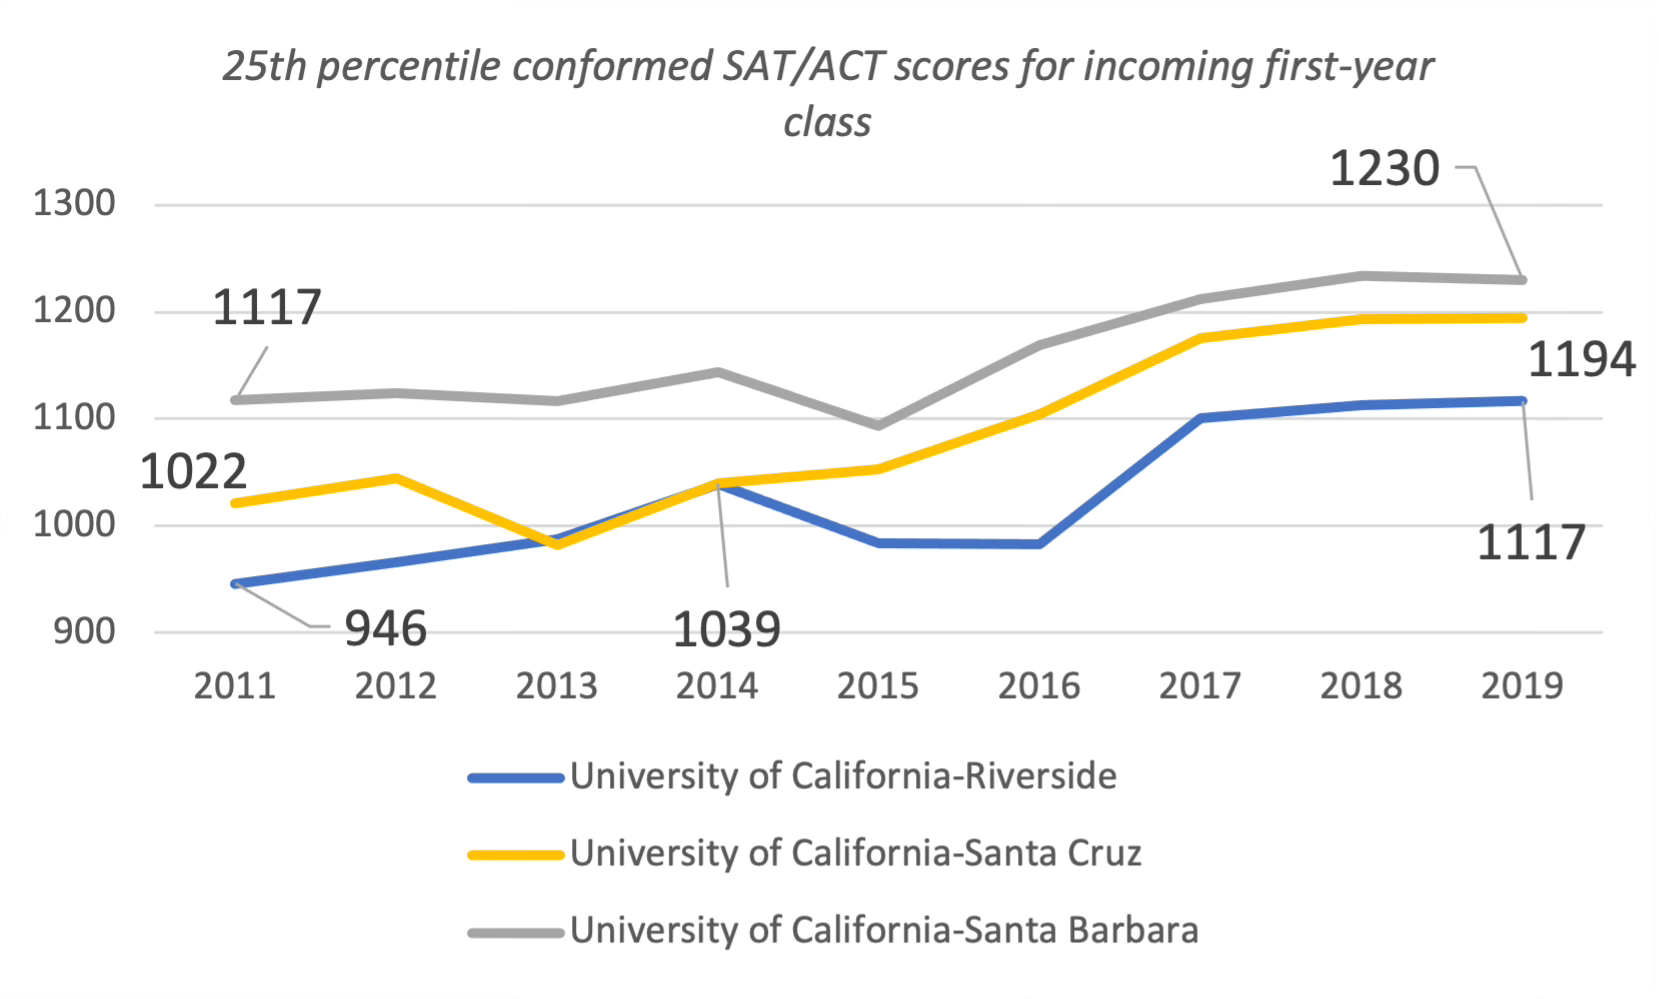
No universities in the country have so successfully increased the academic level of their students as the Santa Cruz, Santa Barbara and Riverside University of California campuses. UC Riverside saw the largest increase the board scores of their bottom quartile of students in any of the set of schools we analyzed and only one school, UC Santa Cruz, increased the scores of their top quartile more.
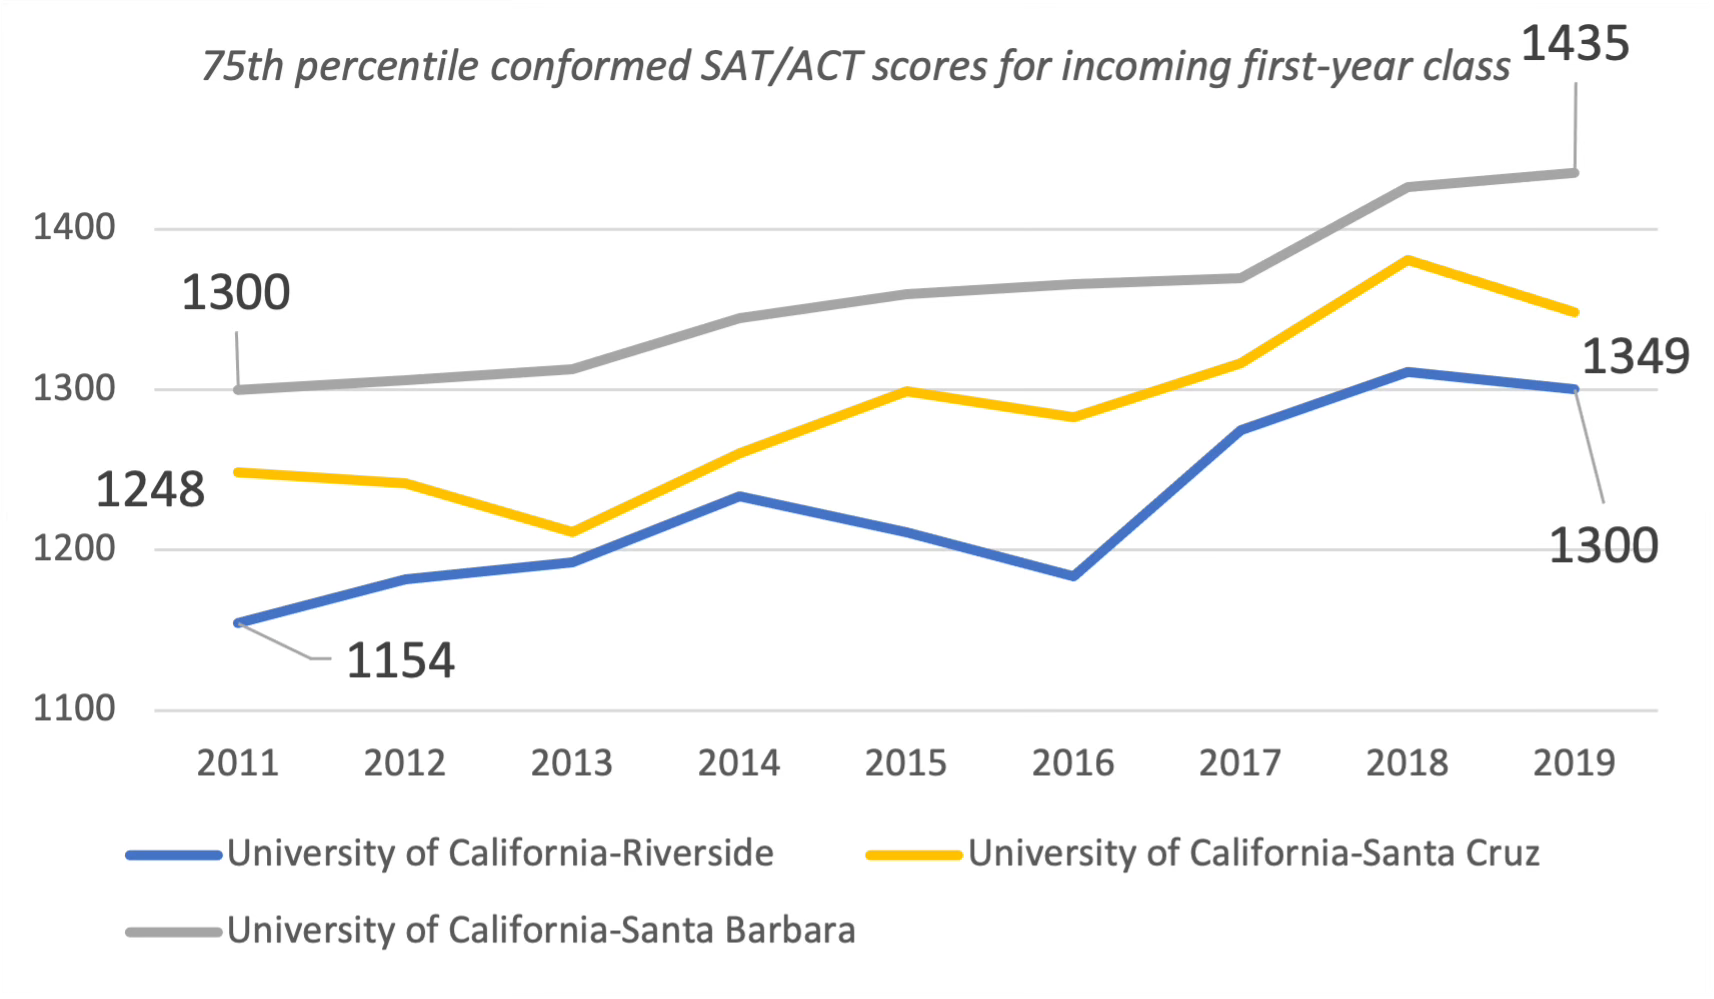
The increase for the 75th percentile threshold was not quite as impressive, but was still very strong:

Interestingly, this increase in scores didn’t take place amid a rise in selectivity. Riverside did show some moderate lowering of admit rates:
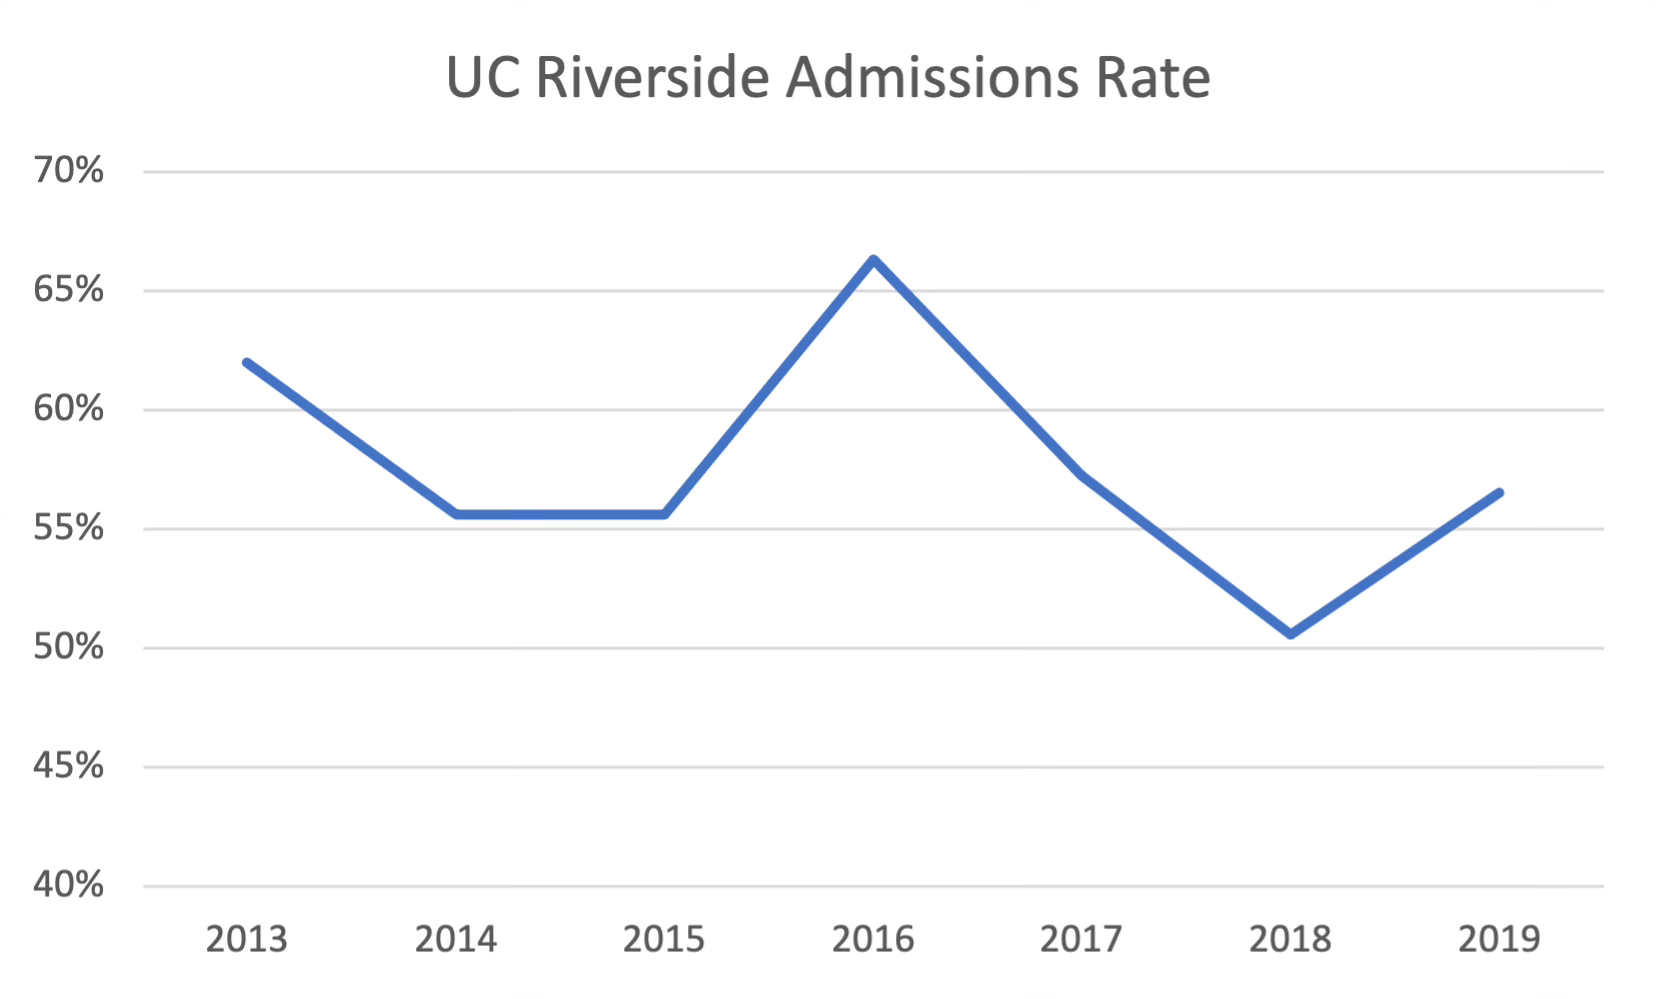
Santa Cruz’s admit rate was also largely unchanged. UC Santa Barbara did show some tightening of selectivity, with its admissions rate declining from 33% in 2014 to 28% in the recent 2023 cycle. But even that decline was more of a drift downward, not the rapid decline in admissions rates colleges such as NYU and Colgate have experienced. The largely flat admit rates together with higher scores implies a self-selection among applicants. In fact, we could even wonder if the universities themselves had a big role in the process; they may have simply been in the right place at the right time. Later in this series, we will speculate about causes.
While tracking metrics such as admissions and yield rates, discounting and financial performance, and overall enrollment would be typical ways to judge an undergrad program’s purely commercial performance, the tracking of SAT scores adds another layer of detail to this evaluation. UC Riverside would appear to be doing just OK based just on their steady admissions rates and yield but, if you peek beneath the hood, you see a university successfully elevating itself within the Golden State’s public higher ed system and successfully competing for desirable high testing applicants.

The performance of these three UC campuses on this index is only more extreme than several of its peers. The general phenomenon of high-achieving students attending prominent state campuses clearly shows up elsewhere in the UC network. Here we compare three of the highest profile UC campuses with Stanford’s 25th percentile SAT mean score.
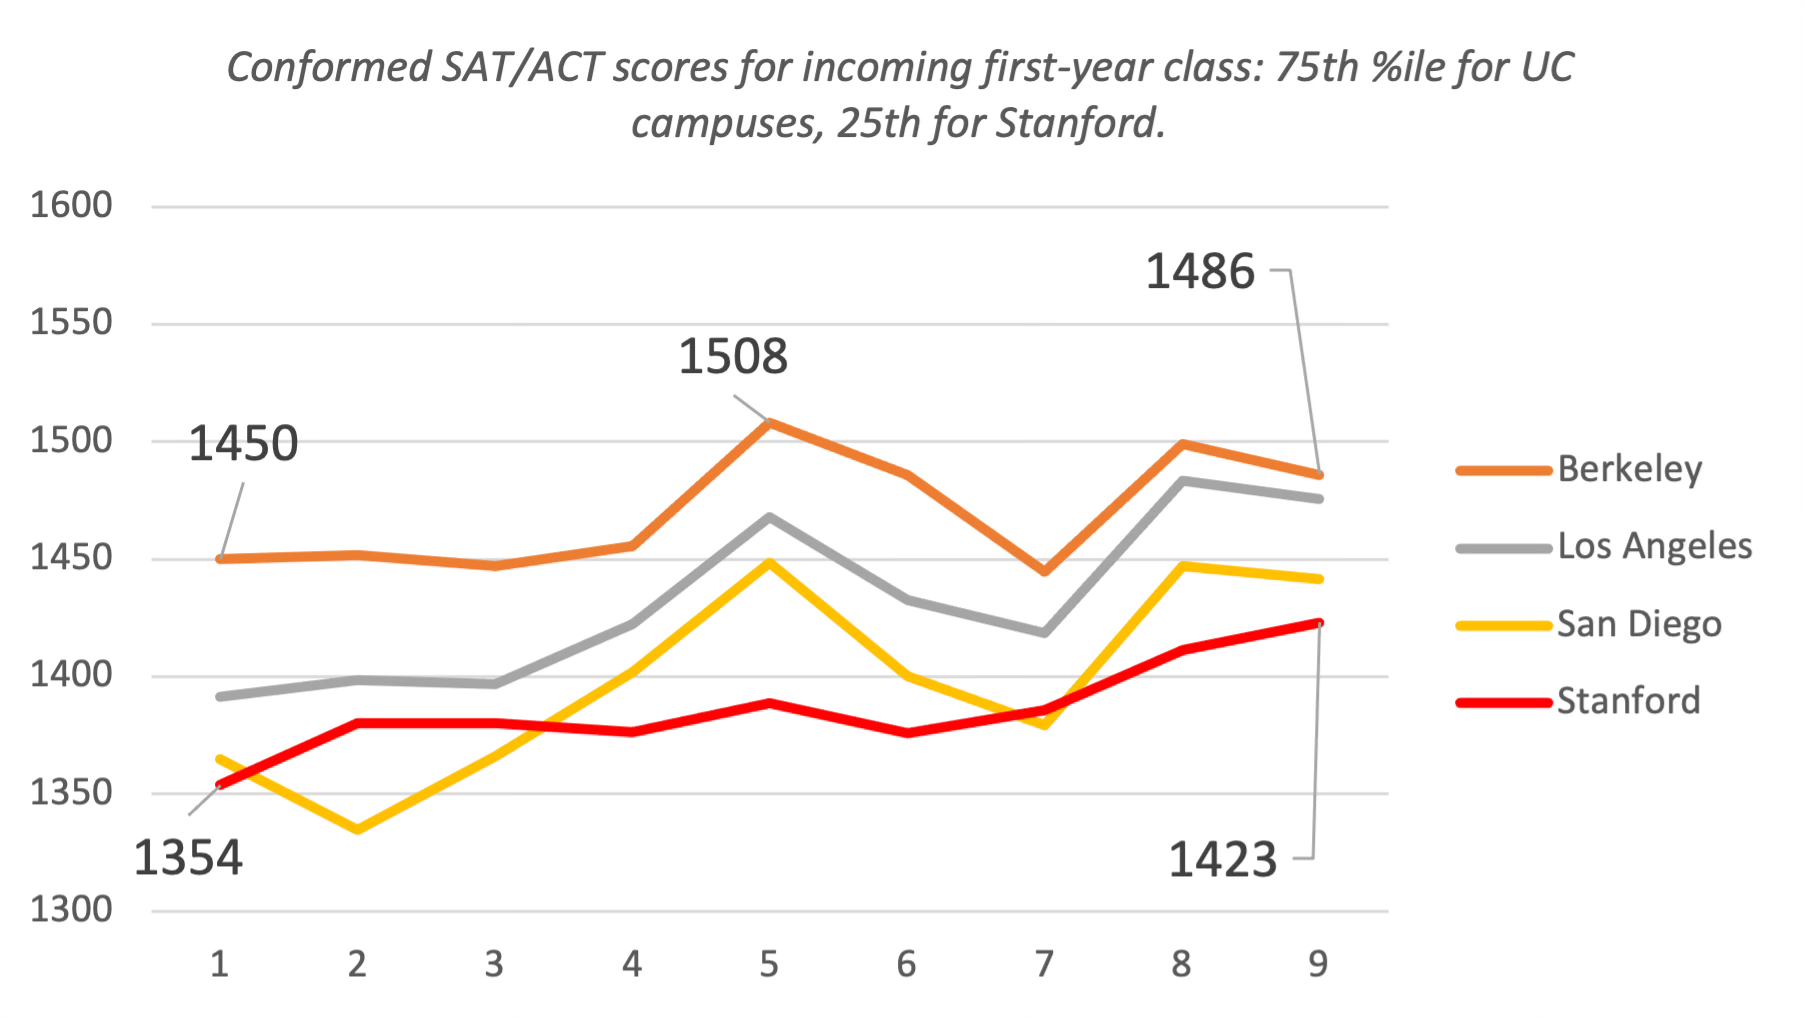
The absolute numbers here are worth pondering. Campuses like UC Santa Barbara and UCLA educate over 30,000 undergrads. The 75th percentile scores suggest 7-9k students test above that level, each campus with more in this segment than the entire Stanford undergraduate program of nearly 6,000 students. For the 6 UC campuses covered in this post, the total number of these students scoring above the 75th percentile approaches 50,000. This is a large group of academic achievers by any measure. Each of these UCs has something approaching a Stanford in its big citadel.
Next week, in part 2 of this series, we will head over to the other side of the nation and look at parallel shifts in the northeast.