
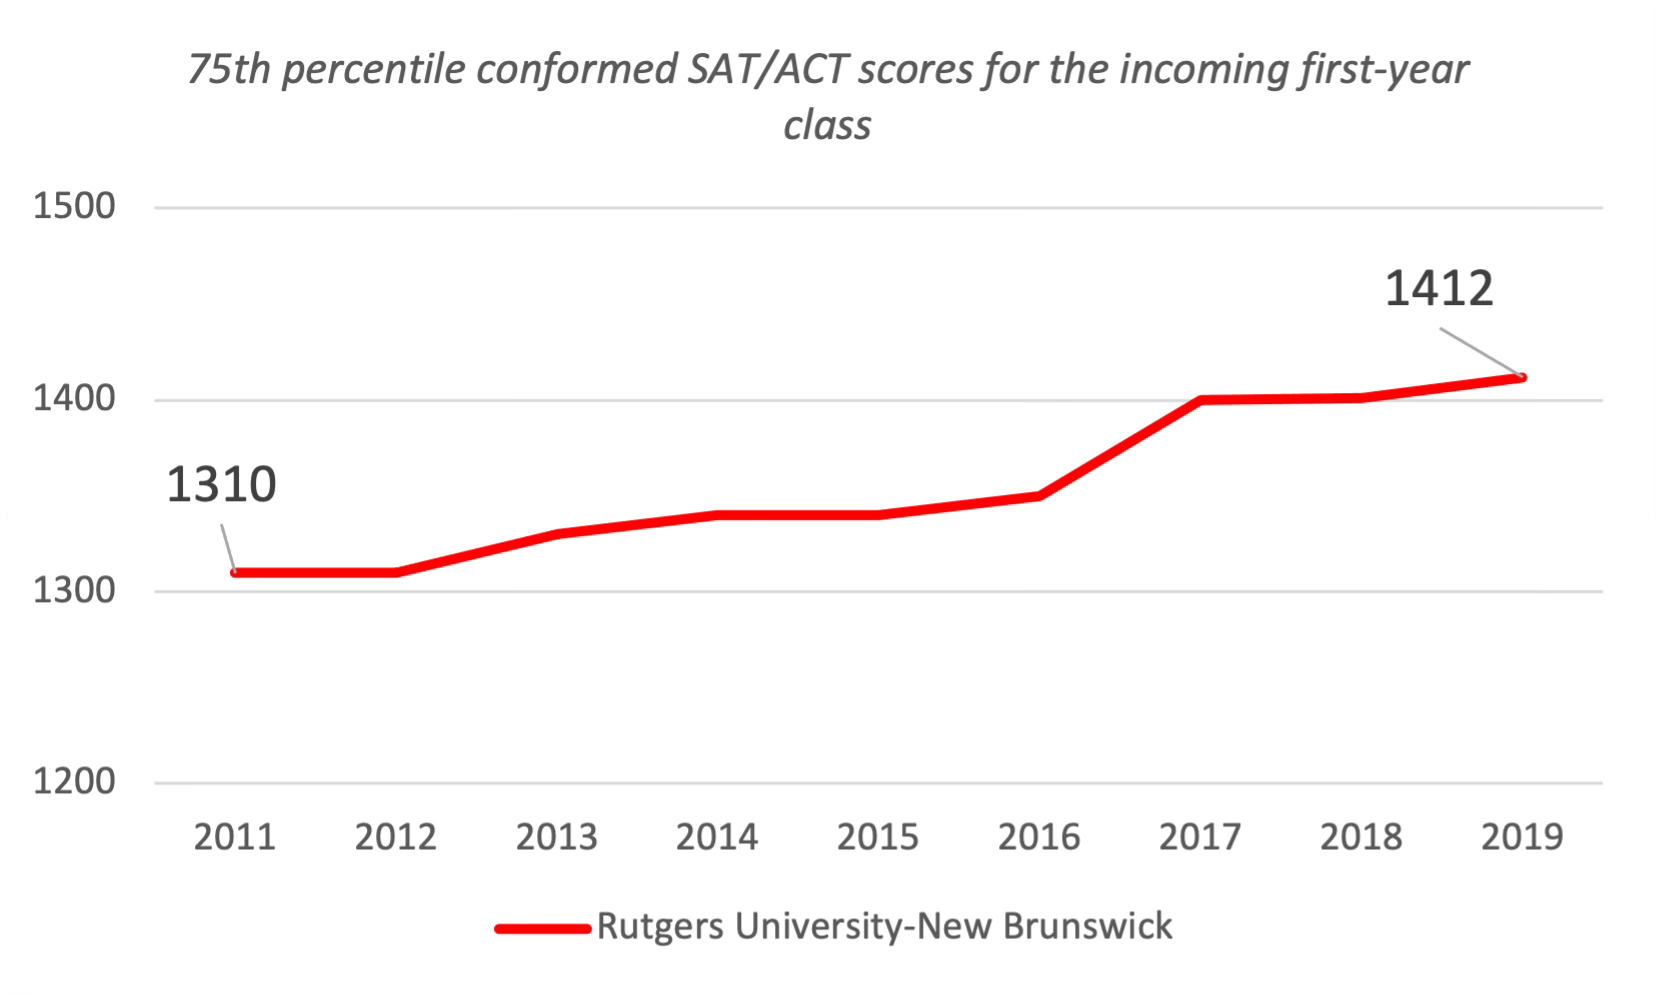
Rutgers University in New Brunswick must number among the most unloved state flagship universities in the US. Not picturesque, sited in suburban sprawl, and long hampered by New Jersey’s active outflow of graduating seniors departing the state, Rutgers just gets no respect. But New Jersey has ventured far past its old image as the home of mobsters and car pollution and is now among the highest income states in the US. And a wealthy state would logically have a high-performing flagship. This is absolutely true of Rutgers, which has seen ascending test scores in the last few years:
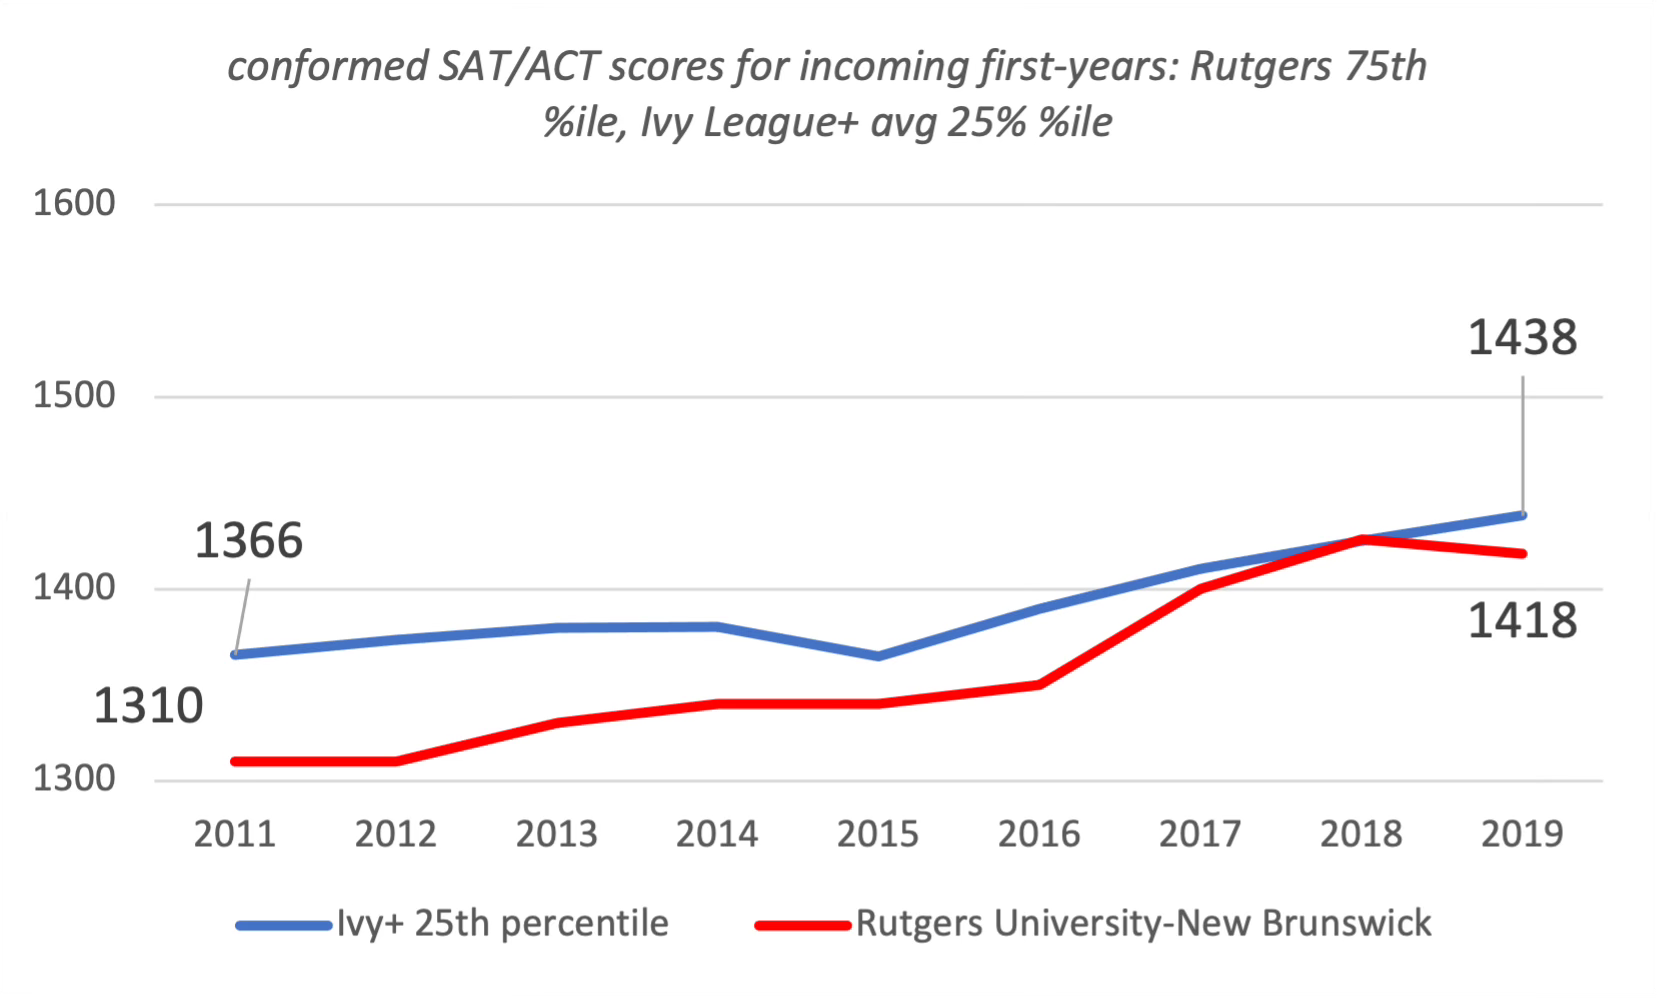
Rutgers’ improvement on this metric is very similar to UC Santa Cruz but less strong than UC Riverside, which we covered in Part 1 of this series. The university has seen this top quartile of test scores rise close to the level of the 25th percentile in the Ivy+ group.
Just as with UC Riverside, this improvement has not been associated with tightening selectivity. About 60% of applicants were accepted by Rutgers throughout this period, with little fluctuation, again suggesting that lower scoring students have gradually selected themselves out. This all took place largely within the New Jersey high school system; Rutgers enrolls less than 10% of its undergraduate body from out-of-state, an unbelievably low figure considering how near New York, Connecticut and Pennsylvania are to its main New Brunswick campus. The phrase “hidden gem” is overused, but applying it to Rutgers – a large, well-known, and centrally located institution – almost seems like a joke. Except that it fits. Rutgers struggles to attract attention outside of the Jersey burbs yet is hosting something like 6,000-8,000 undergrads with SAT scores above 1400. Talk about unloved!
Binghamton
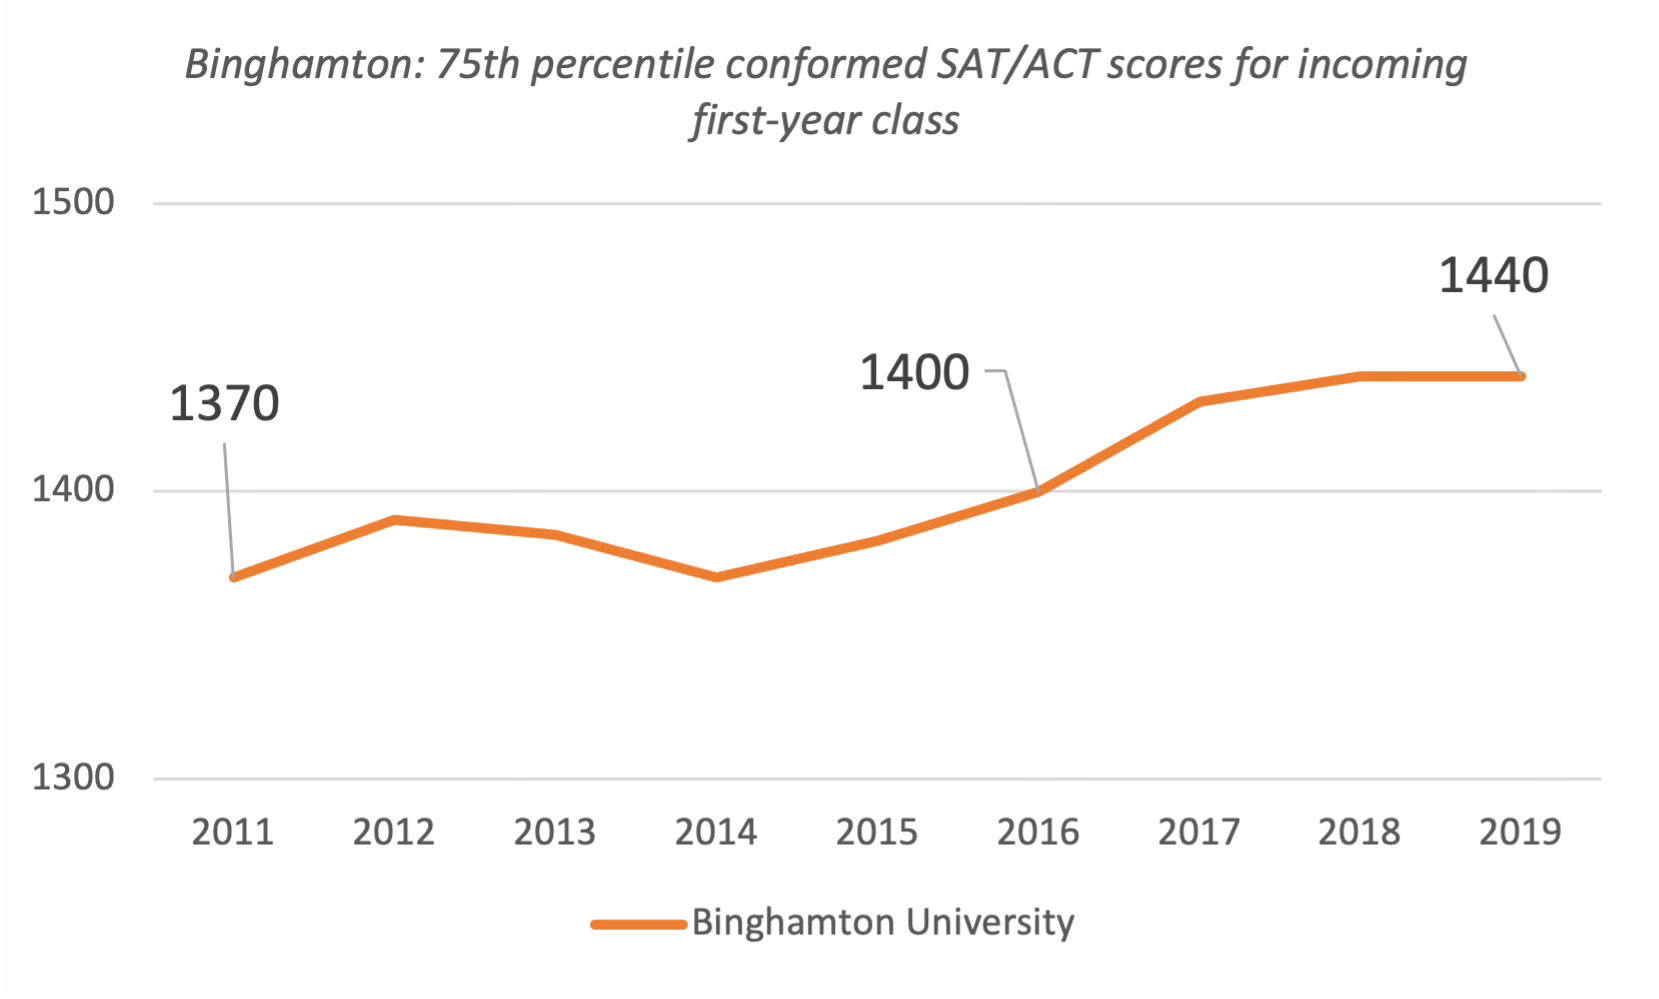
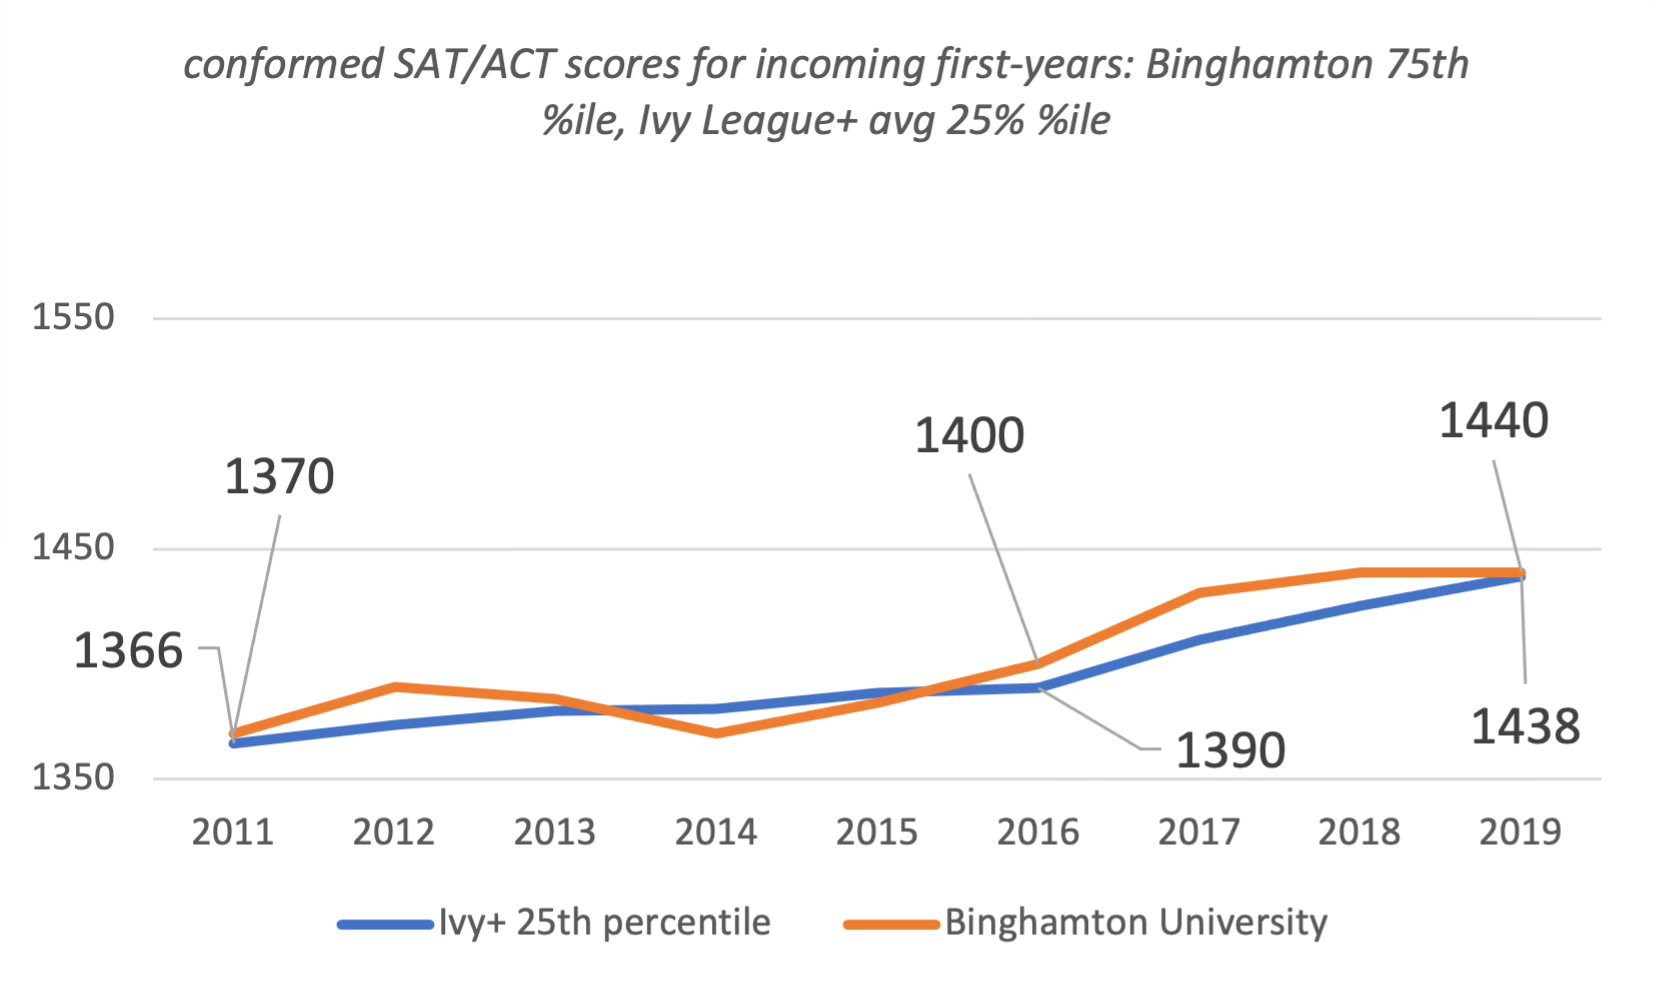
Traveling north from Rutgers, Binghamton’s top quartile has not quite shown the growth of Rutgers and the UC campuses we covered in Part 1 but its absolute numbers are very high: in 2019, a quarter of Binghamton’s students enrolled with a conformed board score above 1440, which we can all agree is a strong result.
Repeating the comparison we made for Rutgers, this 75th percentile tracks closely the 25th for our group of elite Ivy+ universities and colleges:
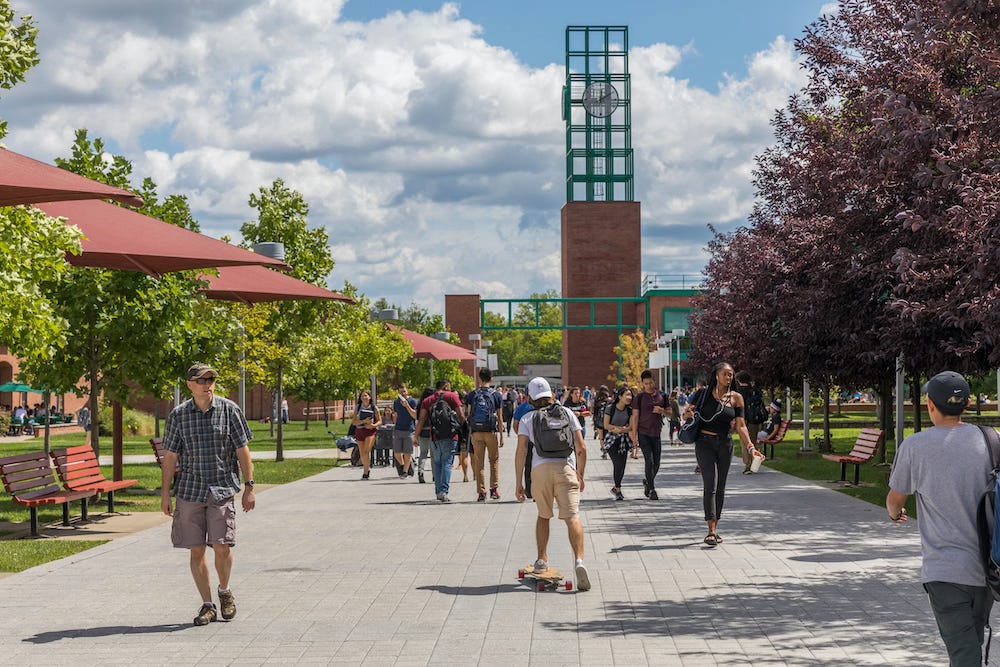
Binghamton is a far smaller program than either Rutgers or the UC campuses we covered, with an undergrad enrollment of roughly 14,000, and perhaps that smaller size explains the lack of attention it seems to receive. It’s truly overlooked. Binghamton’s increase is mimicked at a lower level by its sister campuses:
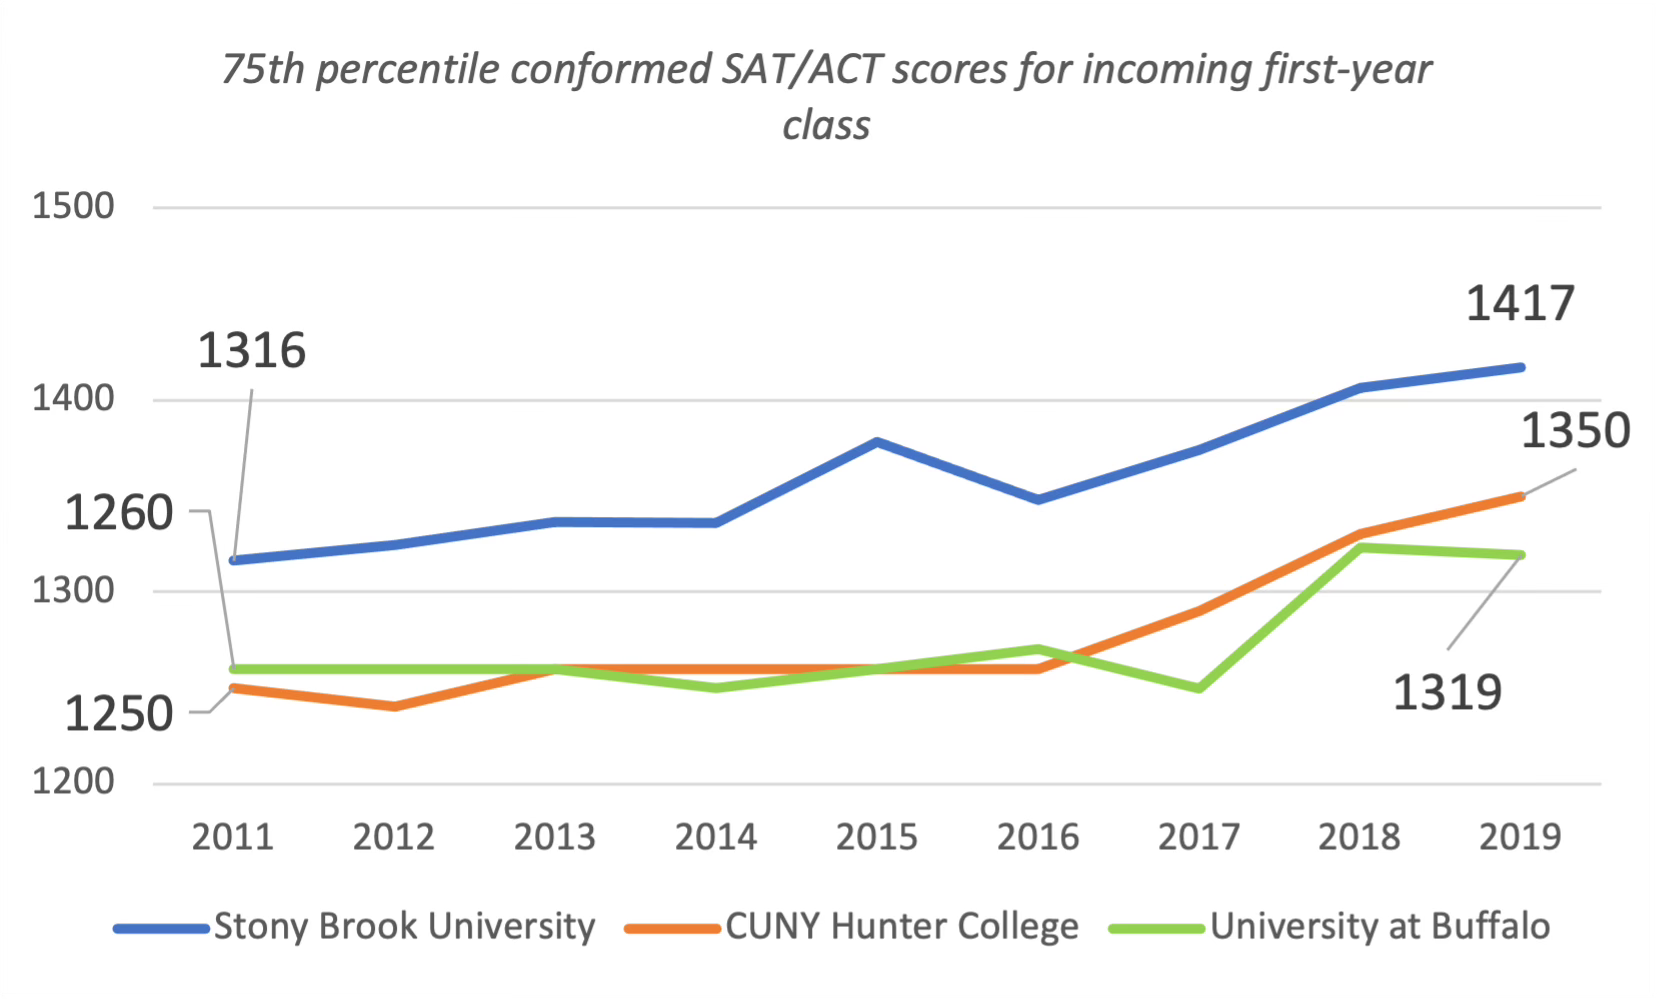
Stony Brook’s climb in academic level is equivalent to that of UC Santa Cruz and Rutgers, with CUNY Hunter making almost equal strides. The rebranded University at Buffalo shows a smaller yet solid leveling up, although the SAT re-norming appears clearly as one driver of this rise.
As with Rutgers and the UC campuses, Binghamton’s ascending test scores has taken place against a largely static admit rate:
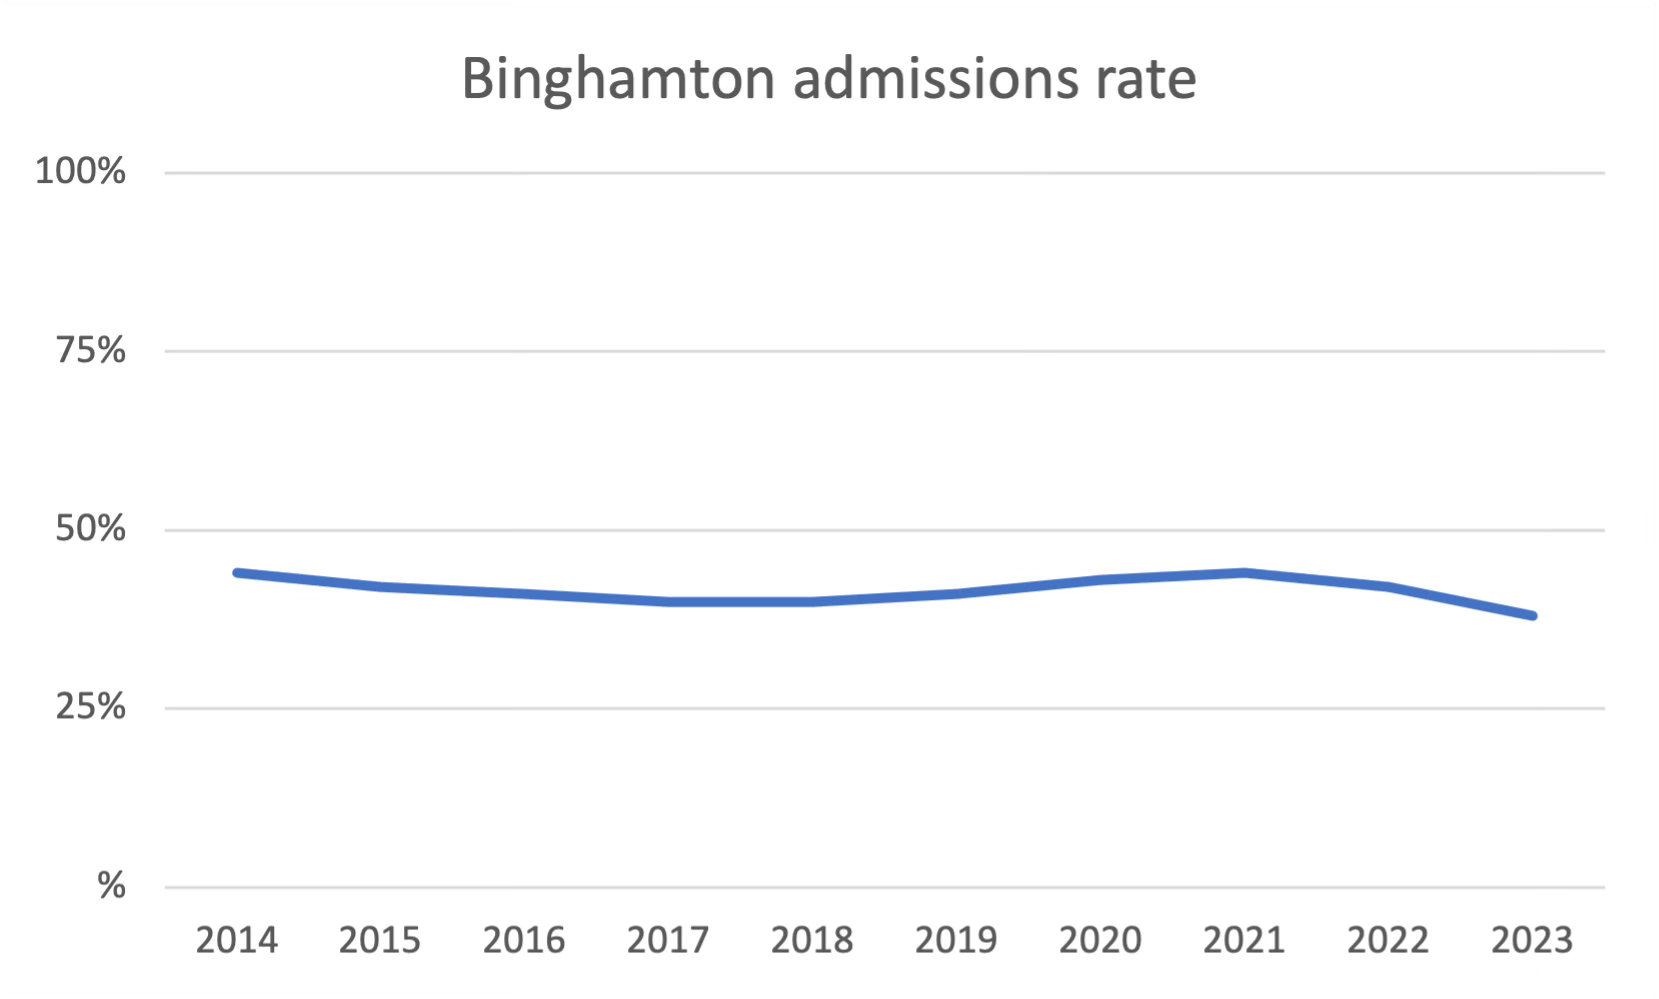
If it isn’t becoming notably more selective, it is one of the relatively few US universities expanding its undergraduate body size:
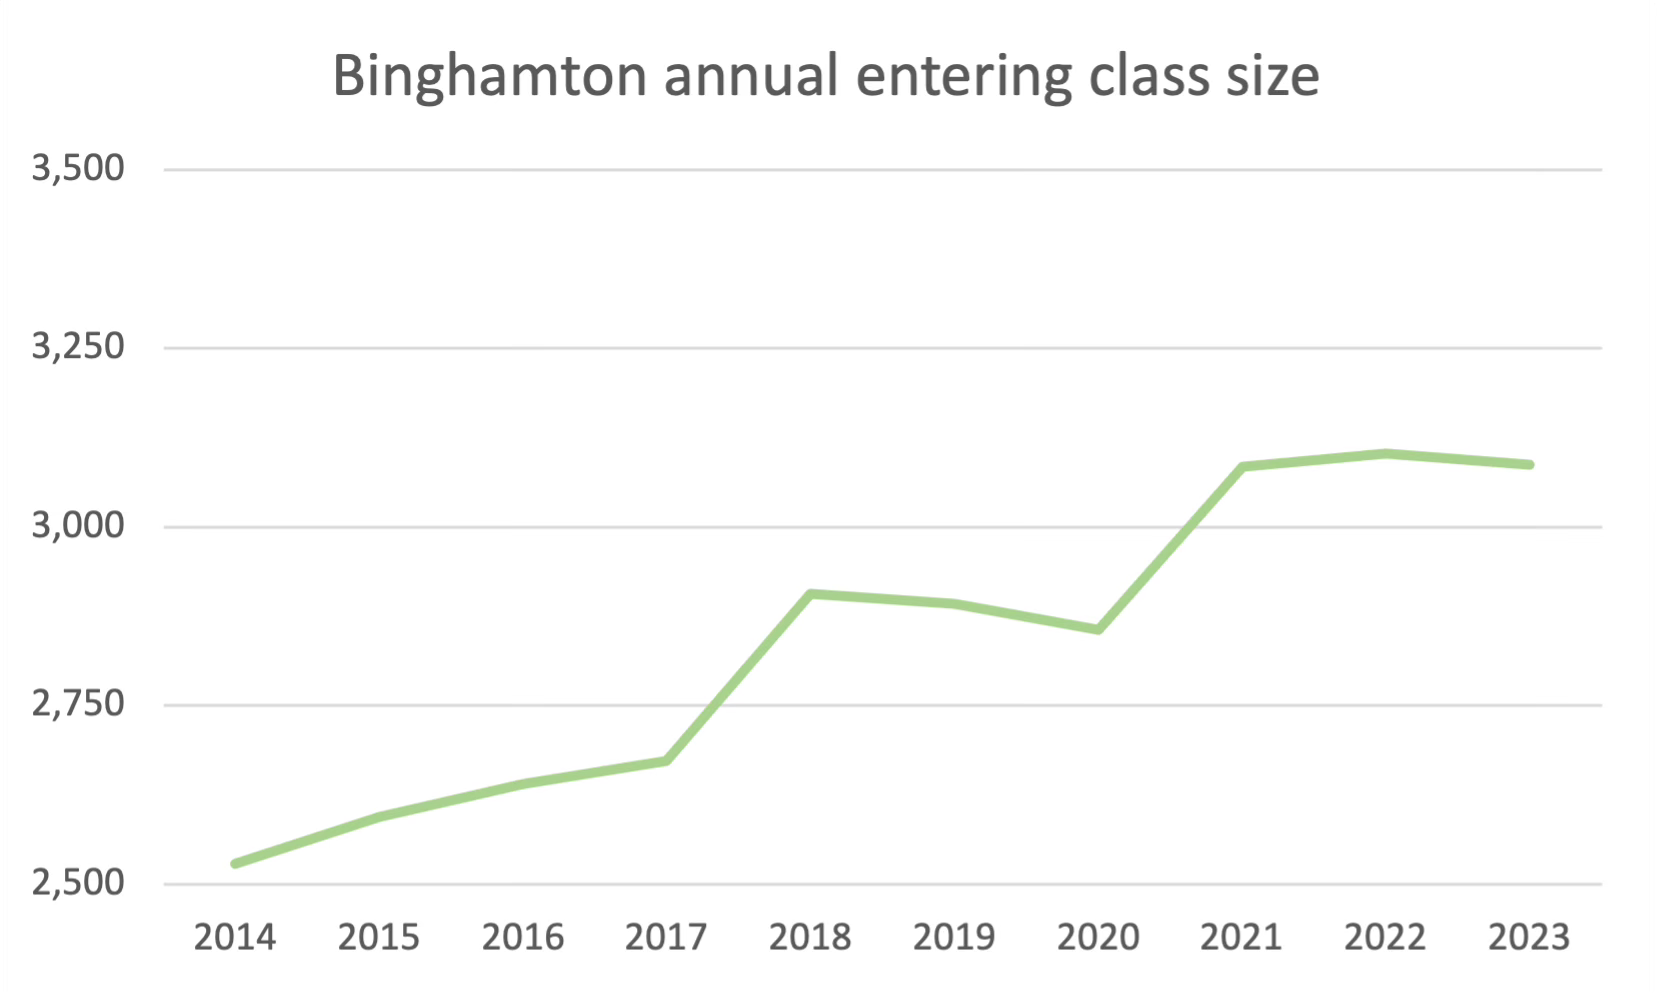
Applications have soared, rising from 28,450 in 2014 to 49,513 in 2023, with the 2023 cycle showing a particularly large jump. Like with Rutgers, this originates with in-state students; 90%+ of undergrads are from New York.
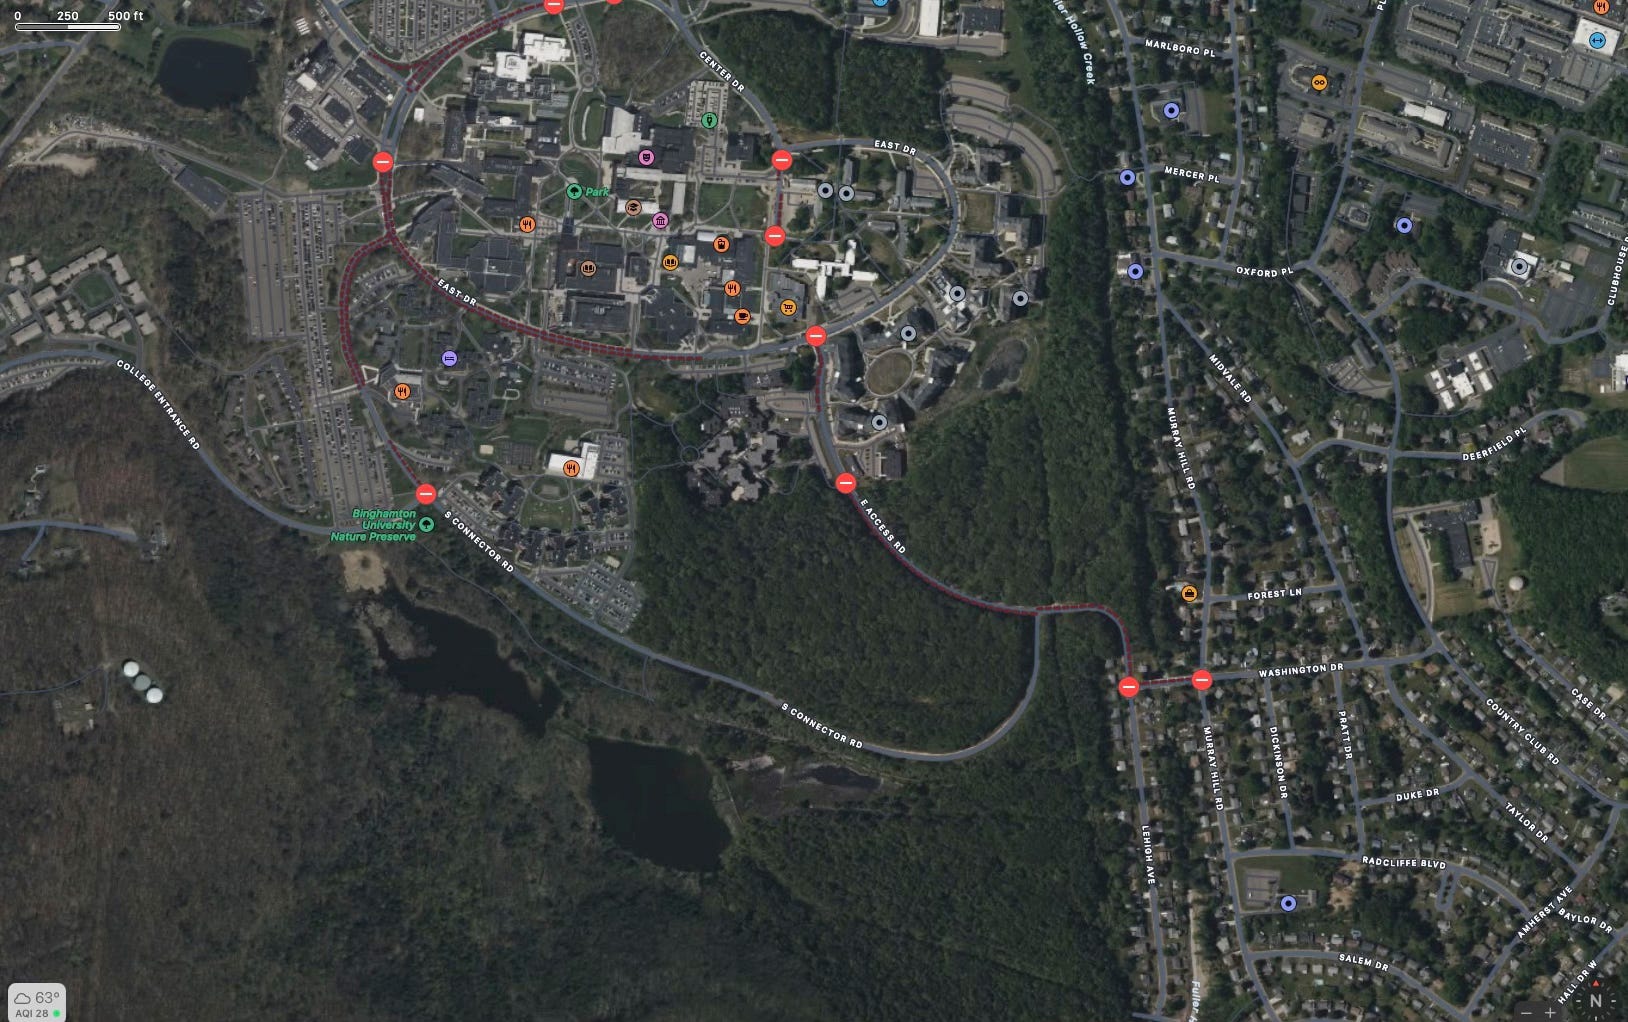
A tangential remark: one of this blog’s consistent themes is that the inability of successful higher ed undergraduate programs to expand their student rolls can be attributed to plain old real estate issues. (For example, we looked at why Villanova University wasn’t expanding despite good enrollment demand here.) Well, Binghamton has in fact been expanding, and a quick Google aerial view reveals one of the reasons why: open land.
Predictions are always dangerous but we expect Binghamton’s expansion to be one of the countertrends in the coming decade. It’s a countertrend because higher ed is likely to retrench in the face of the enrollment “cliff”, increased use of online programs and uncertainty in the wake of AI developments. The specific headwind Binghamton faces in its efforts to expand is the population exodus out of New York State, but we think it will overcome that obstacle.
Though the SUNY system is experiencing some enrollment issues, especially at the less glamorous campuses in the western part of the state, Binghamton is enjoying a great deal of success, a development which seems as underpublicized as its raised test scores. Binghamton can rightly claim it is expanding its public service to state residents – at an in-state cost that remains very low - while at the same time elevating its academic profile and generating more in tuition revenues. Win win.
Two regionals surprise
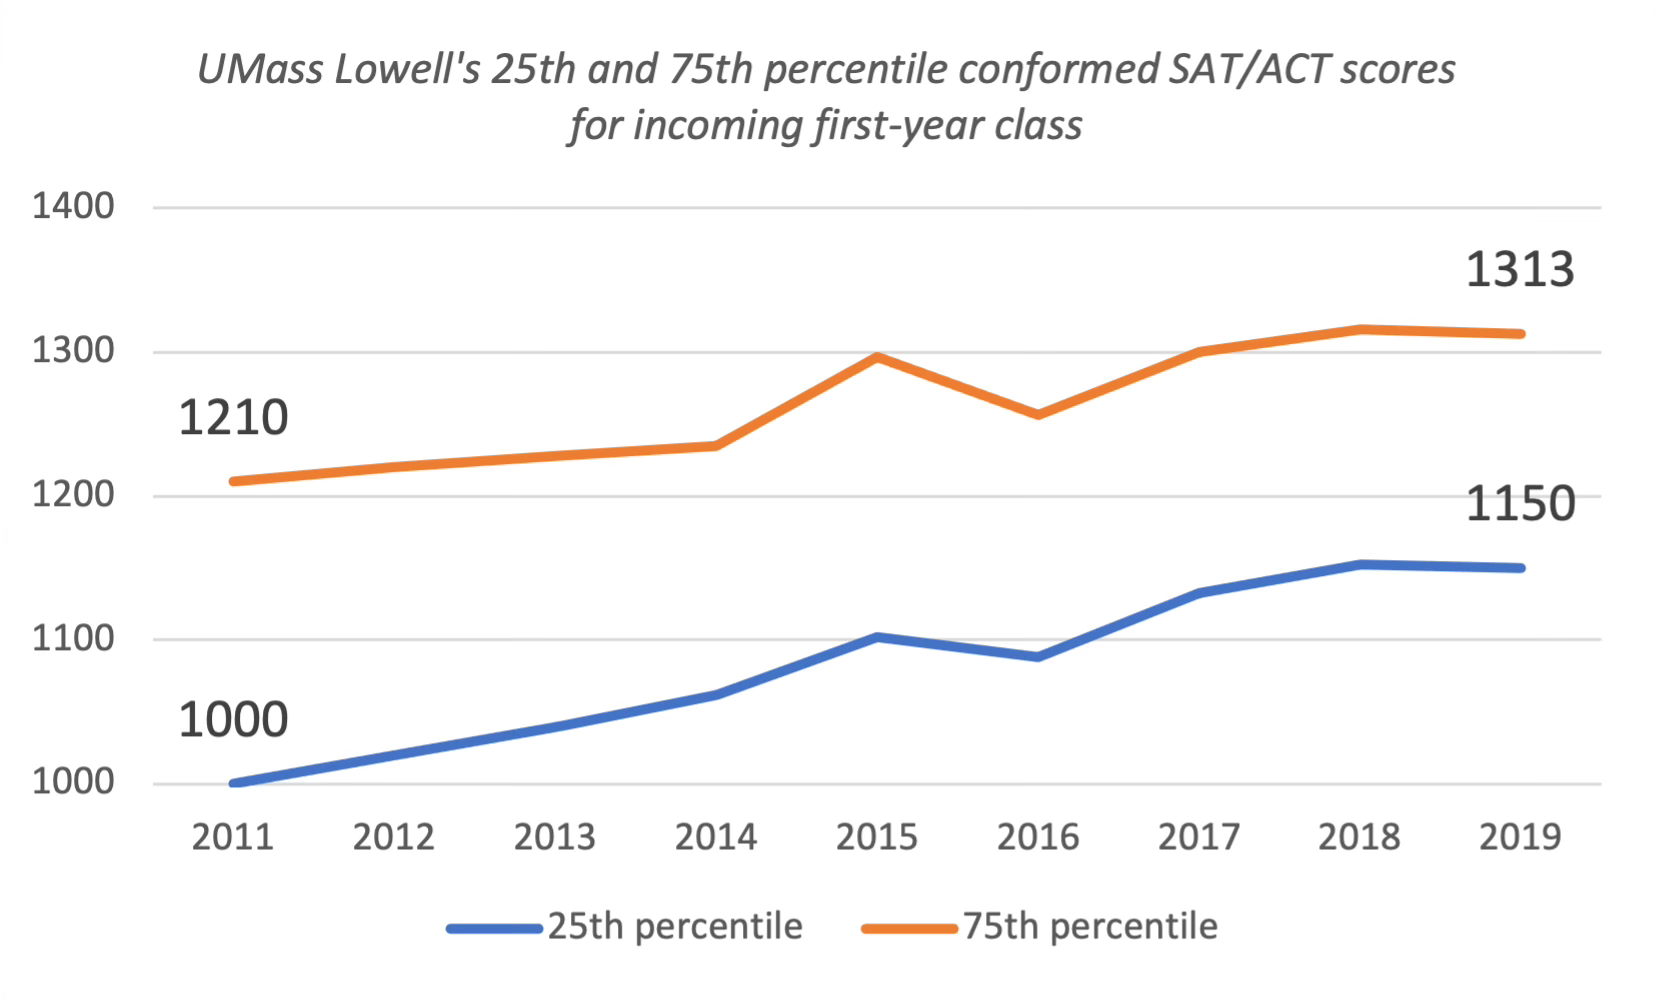
If Binghamton and Rutgers are overlooked, U Mass Lowell exists in some dank, underlit cellar. Located near the Maine border north of Boston and enrolling approximately 13,000 undergrads, Lowell operates in the shadow of the main campus in Amherst. That Amherst campus has been reporting similar increases in test scores as its sister to the north, but we choose to focus on Lowell here because it illustrates how certain non-flagship state universities are admitting many more higher-testing students than in the past:
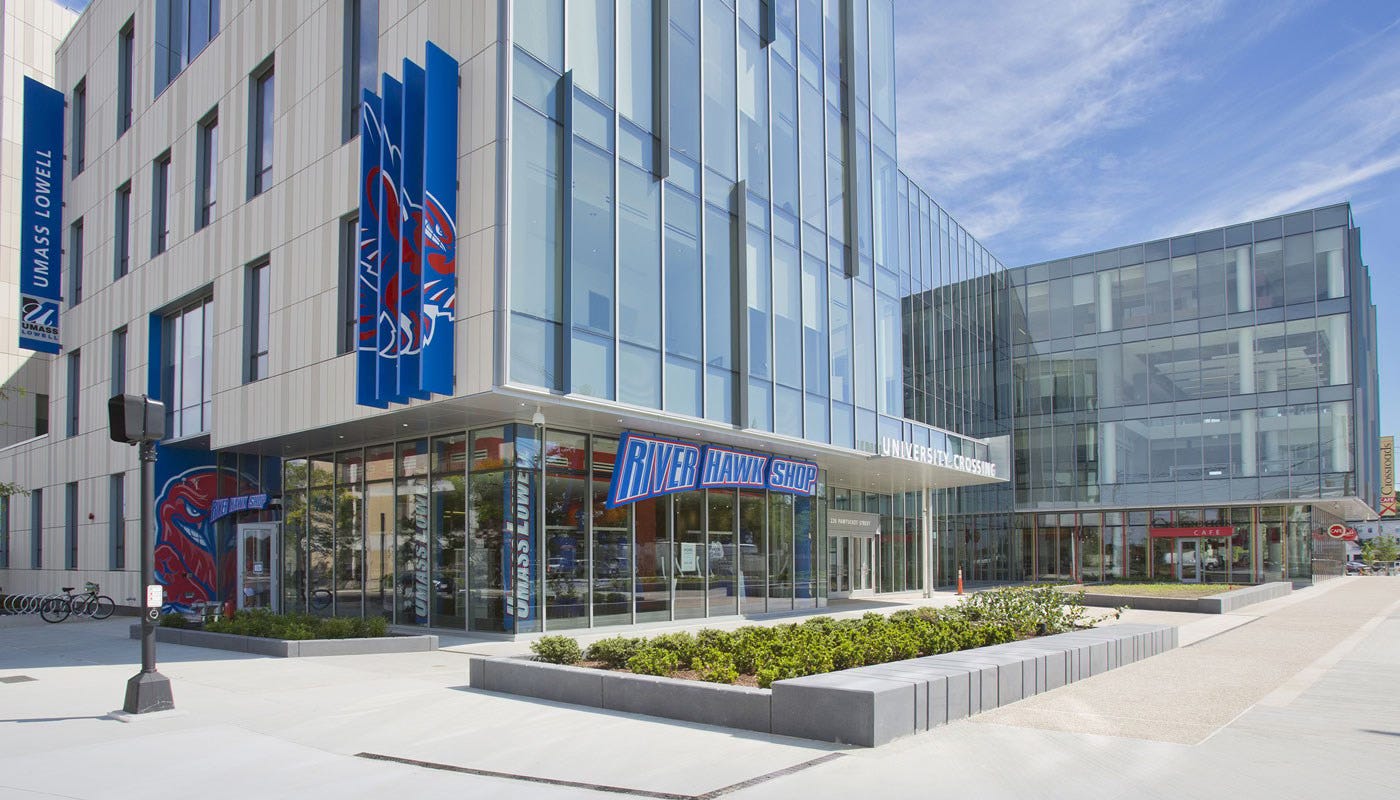
The UMass system as a whole has been facing enrollment headwinds, similar to public systems in Pennsylvania and parts of the SUNY and CUNY networks. Lowell marks an exception and has been increasing its undergrad body size in the last few years, though more slowly than Binghamton. As one would expect in a regional university, this evolution is occurring almost exclusively among Massachusetts’ high schoolers: 89% of undergrads are state residents. Interestingly, in a US system where roughly 60% of undergrads are female, Lowell’s student body is split 62% male/38% female. Lowell also has a large commuter population, with only 38% of students living on campus, but that on-campus population has been growing, attracted by amenities like the River Hawk Village. River Hawk was recently opened, is the university’s 2nd largest residence hall and a virtual tour quickly shows why it would be an attractive place to live while getting your degree.
The other regional with a striking increase in scores sits lower down the seaboard in North Carolina, and that is UNC Charlotte (UNCC):
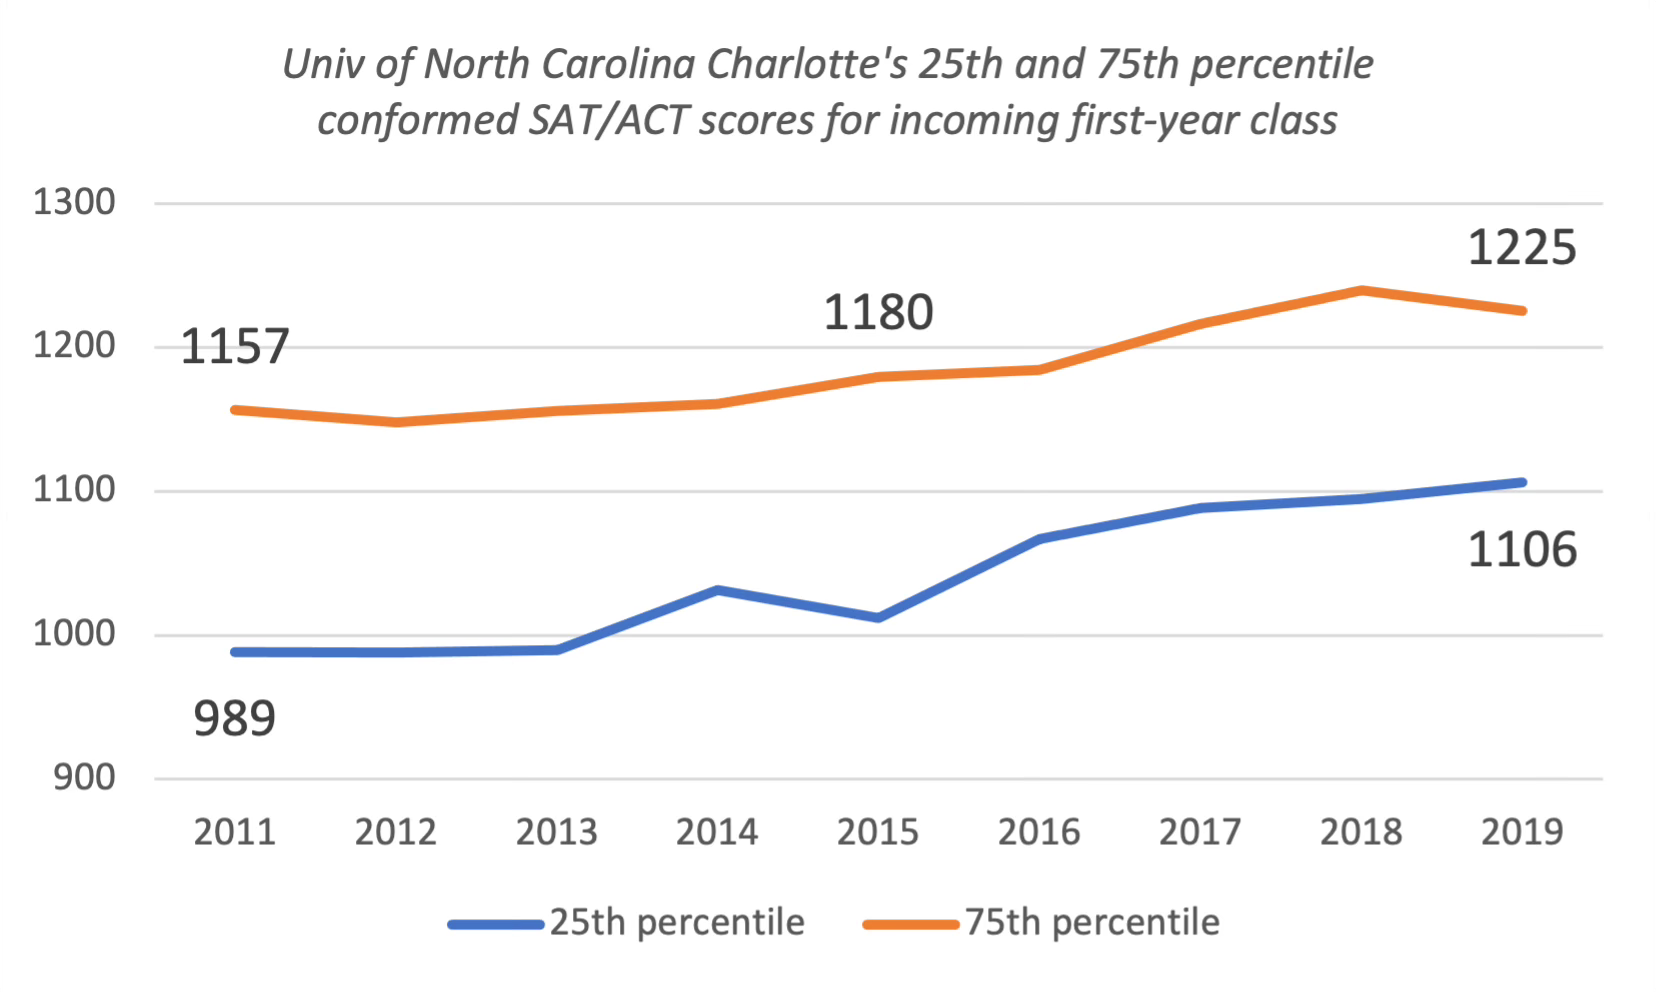
As with Lowell in relation to Amherst, Charlotte plays second fiddle to the better known Chapel Hill campus. UNCC data shows most of the score increases began in 2015, so this is a fairly recent phenomenon. While the increase in the top quartile has been pretty strong, the striking improvement in UNCC’s student profile has come among lower-testing students. In 2011, that bottom quartile was marginal in terms of college preparation but the entering class right before COVID submitted dramatically improved test results. As with the institutions covered before, UNCC’s admissions and yield rates have been largely flat. One peculiarity is that the retention rate – the % of first-year students still enrolled at the beginning of the second year – has not changed much, remaining range bound around 82%. If the bottom quartile of test takers rises by 117 points as it did at Charlotte, one would expect more qualified students staying in school at higher rates – but this didn’t happen. This suggests that the ~18% of first years leaving are not doing so because they can’t handle the classes but because of financial difficulties, transfers to another university or not enjoying the UNCC experience.
UNC Charlotte’s rising scores are mirrored by the largest program in the state, North Carolina State in Raleigh. Adding context here, the flagship program, UNC Chapel Hill has become much more difficult to get into while remaining static in size, so state resident students with good scores are accessing the relatively inexpensive programs at NC State and UNC Charlotte as alternatives. Like with the other universities we cover here, this dynamic is playing out in North Carolina’s high schools, because legislation has long capped the number of nonresidents studying for a Bachelor’s in the public system.
This trend is selective
The analysis that went into this series on Super Publics doesn’t pretend to be exhaustive but focussed only on the bigger public universities across the nation. (If readers have additional examples, we encourage them to bring them up in the comments or messaging here.) But the analysis was deep enough to show that this rise in board scores is seen at certain universities but not others. For example, Bernard Baruch College in the CUNY system has shown level scores throughout the period, in contrast to the New York schools we charted above. Rowan has shown basically no change in this metric, unlike its New Jersey rival Rutgers. In Ohio, Ohio State and Miami University have shown nice gains in scores but Cincinnati and Ohio University are flat. There appears to be a clustering effect, whereby high scoring students are self-sorting prior to even applying and focussing on specific colleges.
Why is this happening? In Part 3 of this series, we will speculate about some possible causes and look at corroborating examples.