How big is the undergrad business anyway?
Looking just at net tuition, 2018/19 brought in $136 billion
Tuition revenue for the entire US industry rose quickly to $126 billion in 2011 but growth has stagnated since then
Price pressure (as measured by Average Net Cost) limited but did not prevent revenue expansion during the Great Recession
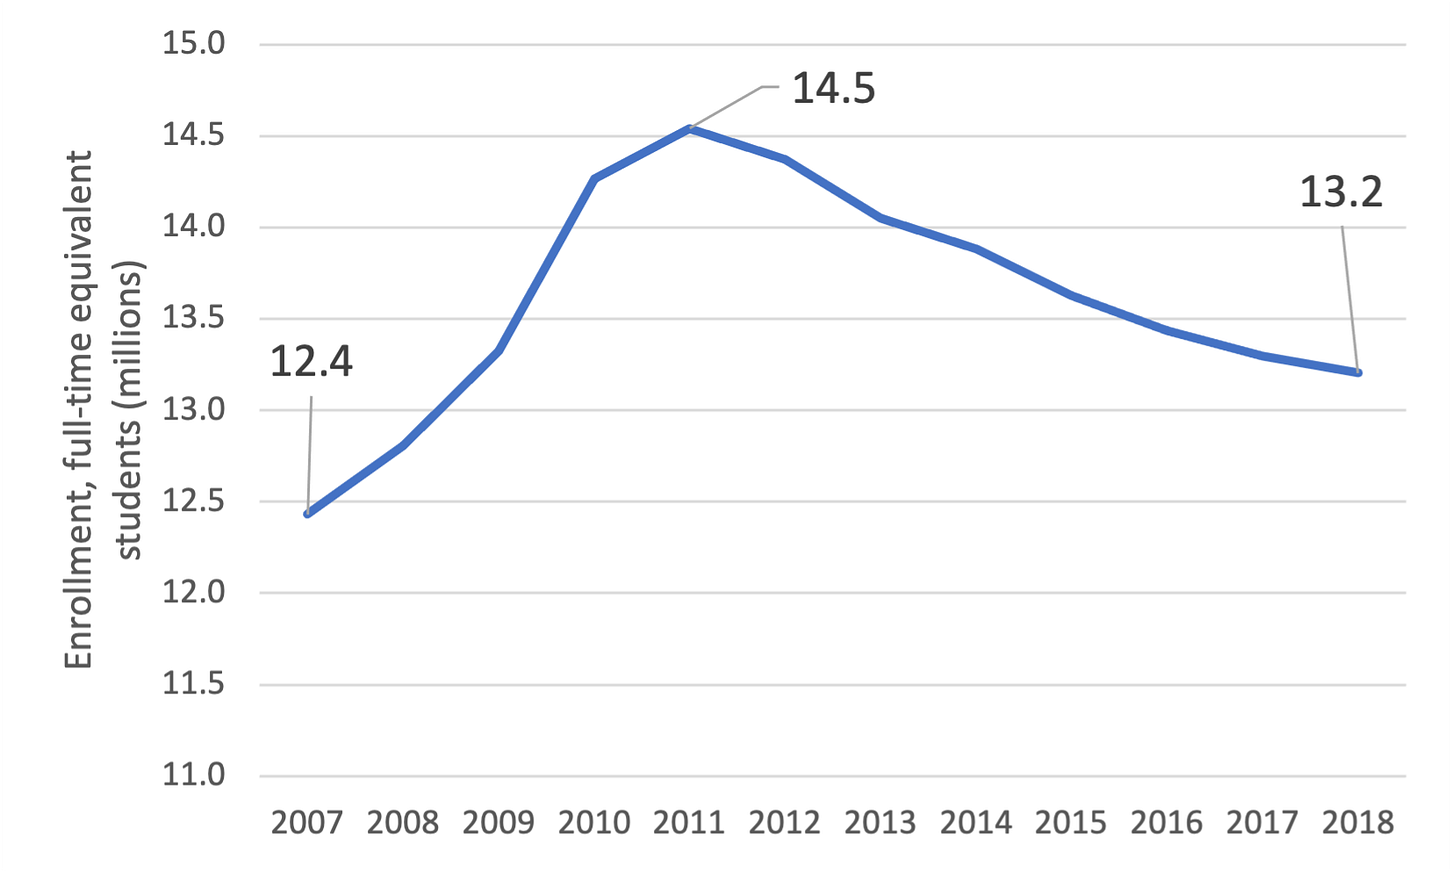
Unit (enrollment) declines in the later 2010s put a brake on growth
Estimating the total size of the undergraduate business, higher ed’s largest segment, can be done in several ways. Due to differences in accounting treatment, simply pulling figures from IPEDS is inaccurate. We approached it in the most direct way possible: revenues are calculated by multiplying net tuition by a college’s self-reported full-time equivalent students (FTEs) which factors in part-time students as a fraction of full-time to arrive at a comparable enrollment basis. Net tuition includes full-list tuition and fees less institutional aid, using enrollment splits between in- and out-of-state US students and international students. Revenue includes grants from the government, including Pell grants, and student loans. Online programs, often offered for a lower price, also reduce estimated revenue for online-only students. Finally, because the universe of US Title IV institutions can include many vocational or non-degree-granting schools, only colleges with over 250 FTEs and clearly-defined tuition reporting were used. This means that the sample set of colleges included in the bottom-line industry net tuition revenue number is close to static throughout the period of 2007 through 2019, allowing for a reliable basis of comparison.
These numbers do not include residential housing and board, ancillary fees such as retail sales, and athletic department revenues. We will take a look at those figures separately. So the net tuition revenue is just part of the pie, but it is the biggest part of the pie.
As mentioned, the undergrad business line saw strong growth from 2007, the first year when we assembled the numbers, to 2011 as the Great Recession encouraged enrollment.
Starting in 2011, growth tailed off, driven principally by an economically cyclical decline in older students, which we have covered elsewhere.
The surge in enrollment during the Great Recession was counterbalanced by concurrently flat pricing: the Average Net Cost charged to students did not change meaningfully from 2007 ($16,313) to 2011 ($16,351). After the recession, colleges were able to regain some level of pricing power, with Average Net Cost rising to $20,283 in 2018/19. These post-recession price changes include increases by individual colleges and also “mix” changes. The “mix” change consists in this period of students trading up to higher-price offerings. Individual annual price increases by a given college in this later part of the decade were on average very close to 1%, below the rate of inflation. Another source of revenue during the recession, the mandated expansion of the Pell program, raised revenues by $18 billion annually between 2007 and 2011, a significant part of industry growth, but only part of it.
Net Cost is a consumer-centric metric which shows costs equivalent to business transactions outside of higher education. It represents a full-time student’s cost of attending college including tuition, room & board, fees and estimates of supplies less institutional aid of all kinds and less government aid. Loans and other repayable amounts are excluded and do not reduce the cost. Average Net Cost as a whole for US higher ed is weighted by individual school FTE.
Setting the Industry net tuition revenue, enrollment and Average Net Cost at an index of 100 in 2007 allows us to visualize the interplay of the two basic drivers on industry revenue.
The graphic shows the Great Recession’s increased enrollment leading revenues up and then dampening them, with some offset from improved pricing after 2011. The gap between the total net revenue increase and enrollment and net cost changes is filled by government aid increases, both in the Pell program and Federal student loans. Another way to visualize this is to look at year-on-year total industry revenue changes and see what the absolute impact of price and enrollment changes were.
Enrollment slips below 0 in 2012 and serves as a drag on industry revenues thereafter.
Concluding thoughts
Higher ed was showing signs of economic stress in the later 2010s. These are averages — smaller schools and community colleges have been doing far worse - so the pinch on certain sectors was even more acute. The slow growth of revenues, averaging just 1.1% from 2012 to 2019, objectively shows why this was so.
We are building the case that 2021/22 will be the beginning of an enrollment resurgence, based on patterns from the last two recessions, the Great Recession and the Dot Com boom. If patterns hold, this will be a good few years for higher ed in terms of enrollment.
For various reasons - poor growth in median family incomes as well as pressure from national online colleges who can add students for near zero marginal cost-- we expect little pricing strength in this period. But the industry can thrive despite this headwind. The name of the game is enrollment growth.
There are many risks to successfully growing college enrollment but the mythical Demographic Cliff is not one of them. The pool of students will be stable for the next few years.
Find this post and other reports at the CTAS website.


